| GISdevelopment.net ---> AARS ---> ACRS 1996 ---> Digital Image Processing |
Automatic Detection of
V-Shaped Features from SAR Imagery
Joji Iisaka1,
Jonathan H.H. Bloedow2 and Takako Sakurai
-Amano3
1Canada Centre for Remote Sensing
588 Booth St., Ottawa, Ontario, Canada K1A 0Y7
Tel: +1-613-947-1237 Fax: +1-613-947-1383
E-mail:Joji.Iisaka@geocan.emr.ca
2macDonald Dettwiler and Associates
240-1101 Prince of Wales Dr., Ottawa, Ontario, Canada K2C3W7
Tel:+1-613-723-7667ex.51 Fax: +1-613-723-7832
E-mail:takako@tkl.iis.u.tokyo.ac.jp
3Institute of Industrial Science, University of Tokyo
7-22-1Roppongi, Minato-ku, Tokyo 106, Japan
Tel:+81-3-3402-6231 ex.2643 Fax: +81-3-3423-2834
E-mail:takako@tkl.iis.u.tokyo.ac.jp
Abstract
1Canada Centre for Remote Sensing
588 Booth St., Ottawa, Ontario, Canada K1A 0Y7
Tel: +1-613-947-1237 Fax: +1-613-947-1383
E-mail:Joji.Iisaka@geocan.emr.ca
2macDonald Dettwiler and Associates
240-1101 Prince of Wales Dr., Ottawa, Ontario, Canada K2C3W7
Tel:+1-613-723-7667ex.51 Fax: +1-613-723-7832
E-mail:takako@tkl.iis.u.tokyo.ac.jp
3Institute of Industrial Science, University of Tokyo
7-22-1Roppongi, Minato-ku, Tokyo 106, Japan
Tel:+81-3-3402-6231 ex.2643 Fax: +81-3-3423-2834
E-mail:takako@tkl.iis.u.tokyo.ac.jp
Spatial and geometrical information of image features are key elements in the terrain feature detection. Those features are not only affected y speckle but also affected by various other factors. Among various geometrical patterns in SAR imagery, detection of thin line features are particularly difficult because the image resolution is often coarser then the wide the corresponding terrain objects. In previous studies, circular patters, straight lines and interactions were successfully detected. As a subcategory of thin line features, in this study V-shaped features were investigated using ship wakes as examples. Based on the "Information Fusion" approach, many confusing features were eliminated gy combining various spectral and spatial information and also integrating existing knowledge before applying Housgh transform for line detection. It was found that this approach works fairly well for the images where the V-shaped features are by no means significant.
1. Introduction
With SAR data becoming increasingly popular, the development of algorithms with can automatically detect geometrical shapes effectively and efficiently is an important area of inquiry. Such algorithms have many applications in industry. There are, however many obstacles and difficulties encountered when trying to detect such geometrical features from SAR imagery. Such features are not only degraded by speckle but also affected by various factors such features from SAR imagery. Such features are not only degraded by speckle but also affected by various factors such as wavelength, radar look direction, water content, surrounding objects and therefore those features may not appear as wavelength, radar look direction, water content, surrounding objects and therefore those features may not appear as those observed by visible sensing. Among those geometrical features, thin line features are particularly difficult because the resolution of SAR images, especially multi-look images, is often coarser than the width of the corresponding terrain objects and they may disappear, wiggle, or attach to the tot he surrounding features. We have successfully conducted several studies of detecting thin liner and circular features from SAR imagery in an approach integrating various spectral, spatial and geometrical information as well as non-image information [1-4]. We later called this approach "Information Fusion Approach" [3-5].V-shaped thin features is a sub-category of thin line features. In this study, we applied the same approach to he detection of V-shaped features using ship wakes as examples.
Since the detection of ship wakes is an area of acute interest in itself, many studies have been carried out [6-11]. Since the traditional methods of line detection such as edge detection did not work for SAR images, these studies of detecting ship wakes were oriented around global Hough transform based techniques. Those algorithms were tested on small images, mostly simulated images and few real images, in which the ship wakes are dominant features. In real application, however, the image size is very large and ship wakes are by no means significant features. These are many other interfering and confusing features as well. Therefore the previous methods could be either computationally costly or could not work well.
We used a 6-look ERS-1 image of relatively large size, in which he ship wakes are of minor significance. The algorithm can be divided into three major steps, the first step is a pre-processing to reduce the candidate space as much as possible, the second step is the core part of detecting lines using a Hough transform based method, and the final part is finding the most-likely V-shaped candidates, in this case ship wakes, from these line segments. The results are very promising.
2. Aproach
our entire approach to detect various shape has been based on "Information Fusion". In this approach, various useful spectral, spatial and geometrical information are extracted from the image with simple and efficient operators sand integrated together [12]13]. Each operation does not need to be perfect. Various types of non-image information are also integrated.
Line detection is the core of the entire process of detecting V-shaped features and a Hough transform based method was employed in this study. Instead of applying the Hough transform directly to the raw images, unwanted and confusing features were eliminate as much as possible before applying Hough transform. After Hough transform, detected candidate lines were overlaid with intersecting lie segments as the ship wake candidates. The entire procedure is shown in Figure 1.
Figure 1 Procedure for V-shape Detection
3. Experiements
the algorithm was developed on one image in particular shown in Figure 2, a 1000 pixel by 1000 line 6-look ERS-1 SGR( SAR Georeferenced Fine-Resolution) product image of Lake St. Claire on the border of the United State and Canada beside he city of Detroit, Michigan, USA acquired on June 18, 1992. According to the weather data, this was windy and rainy day. The average wind speed the hour the image was taken was 35km/h. This made the entire water surface quite rough. Two large ships are moving slowly towards the upper right corner. Along the shore of Detroit, a couple of small ships, one is traveling upward and one downward.
Figure 2 6-look ERS-1 image of Lake St. Clair
1) Preparation of Line -like Candidates
Speckle Reduction
The speckle noise was reduced using the SFP (Small Feature Preserving )filter (14) to minimize the loss of the thin feature.
Removal of Land Portion
The land portion of the image was eliminated to reduce the search space since the ship wakes are the water surface features. Instead of using a geographical map or a TM image to discriminate land from water, a mophological closing operation was applied to the very bright point-like features to define an approximate urban area [12,13,15]. The remaining small dark areas on the land were eliminated by setting a certain size threshiold and retained a large lake area.
Extraction of bright object at multiple threshold levels
Binary images of bright pixel were created at multiple threshold levels systematically, in this case, at a constant gray level interval. Since the ship wakes generally appear bright in the water image, some of the distinct sub-feature belonging to the ship wakes may appear at least in some of those binary images and other distinct features may appear in other binary images. In the original iamge, the background waer surface is darker near the shore, non-negligible amount of the ship wake pixels are darker thanthe histogram maximum of the water area, therefore the threshold value range coverge almost entire histogram (3%-99%) of water area. If background is even, it may be sufficient to cover a range in the brighter side of the histogram to extract most of the distinct ship wake features.
If features are dark although all ship wakes in this study appear bright, multiple dark object images instead of bright object images should be created at the threshold values on the darker side of the histogram[4]
Extraction of line-like pixels
Line-likeness in a 7x7 window was evaluated for each pixel in each bright object using an area-likeness operator derived from the Pixel Swapping Theory [13,16]0 and summed over the entire threshold values. The highly line-like pixels have high line-like values and less line-like pixels have smaller values. In order to eliminate an accident likeness, pixels with a value smaller than 2 were eliminated.
2) Peak Detection in Hough Space
Hough transform
A simple Hough transform[17] was applied to the entire image. The image was decimated to half because of the software restriction. Figure 3 shown the Hough transformed image.
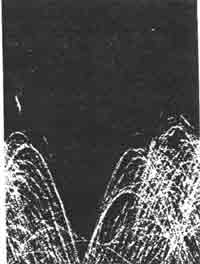
Figure 3 Hough transformed image
Peak sharpening
Since the lines in SAR images are not straight and narrow, the peaks in the Hough transformed images appear noisy and diffused and those peak needed to be sharpended. The method chosen here was first to average the Hough image by a moving e by 3 mean average filter, second to apply gray level erosion with a flat 7 by 7 structuring element and third to subtract the second image from the resulting image has much sharper peaks as shown in Figure 4.
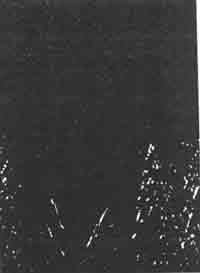
Figure 4 Peak sharpening in Hough space
Peak detection
- Local maximum method
one method of peak detection used in this experiment was to find a local maximum within a 25 by 25 window and retain only peaks above a certain threshold value. Then a simple centroid clustering algorithm was applied to retina only one point for a cluster of peak.
- Genetic Algorithms
Considerable experimentation was done with Genetic Algorithms. Genetic Algorithms are otimization techniques based on concepts from population genetics [18] . a population parameter was 500 and the fitness function was the actual gray level of the pixel indexed by the "guessed coordinate". Only the fittest coordinates were kept. Once a peak was found in one instance of the algorithms, it was delected along with its surroundign area and the algorithms executed again until a certain number of peaks were found.
Extraction of brightest segments from each line
The final points in Hough space were then converted back into lines in an image space. Those lines wer overlaid onto the preprocessed image (the input to the Hugh transform) and each pixel was individually weighted based on the gray the preprocessed image (the input to the Hough transform) and each pixel was individually weighted based on the gray levels of 5 by 5 neighborhood around the pixel. The line was iteratively divided into cluster according to pixels intensity. If a cluster was larger than approximate length of the features of interest, then it was subdivided into two smaller cluster. When the entire line has been divided into lie segments that are all sufficiently short. The brightest segment was selected and others are ignored.
Extraction of intersecting line segments
The final step was to look at all line segments selected and retain only those that had at least one interestion with other line segments.
4. Results and Discussion
Figure 5 shows the final extracted V-shaped ship wakes. The Information Fusion Apprch worked farily well to detect V-shaped thin line features which are only manor importance in the image. A very clear upward pointing ship wake in the lower left of the image and a V-shape wake for the ship in the top right corner of the image were successfully extracted. No ship wakes could be found for the ship in the middle, as it had no ship wake visible in the original image. As well, the wakes for the downward ship in the bottom left of the image were not extracted probably because it does not form a clear V-shape.
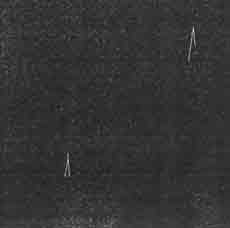
Figure 5 Ship wakes extracted from the ERS-1 image
The algorithm was tested on a 1000 line 4 - look RADARSAT image of the Atlantic Ocean southwest of Wales, UK taken on February 29, 1996 shown in Figure 6. the image shows two ships and the corresponding wakes visible to the naked eye, both traveling in a generally upward direction. The background water is fairly rough and the ship wakes are not very obvious features. The result for the RADARSAT image shown in Figure 7 is very good without a false alarm. However, the wakes extend to the other direction because of some small bright features on the line. It clearly shows that at least one more evaluation step is necessary after extracting intersecting line segments to remove those extra features. It can done by evaluating the pixel intensity distribution of the all branches of intersecting line segments or/and by evaluating the intersecting angle.
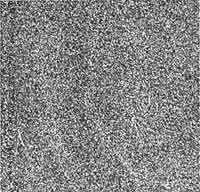
Figure 6 RADARSAT image of Atlantic ocean southwest of Wales, UK.
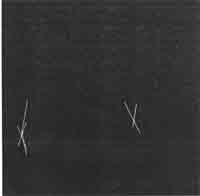
Figure 7 Ship wakes extracted from the RADARSAT image
The results may be further improved by the following consideration.
- Integration of more knowledge. The search space of the ERS-1 image is further reduced by integrating the ship route. This will certainly eliminate most of the confusing line-like features on the rough water area away from the shore. Those must be some water area for feisue boats. The similar improvement can be expected for the RADARSAT image if such a map is available.
- Localized Hough transform space. In this experiment, Hough transform was applied to the entire image plane. If Hugh transform was applied in the subspace around candidate line-like features, it will enhance the accuracy but also reduce the number of confusing feature.
- Additional simple spatial operation to simulate the spatial elongatedness. Only three steps were applied in the pre-processing to eliminate unwanted features, additional processes such as estimating a medium range elongated spatial distribution. These operations could further reduce the number of confusing features.
5. Conclusion
the "Information Fusion Approach" works quite well to detect insignificant V-shaped features from relatively large image. the system can be further improved by integrating more knowledge and more efficient process. Genetic Algorithms have potential, but do not work as quickly as the image processing approach.
References
- J.Lisaka and T. Sakurai-Amang, "Circular pattern extraction from remotely sensed imagery using Genetic Algorithms", Proc. GIS'95, pp.382-390, Vancouver, Canada, 1995.
- J.lisaka and T.Sakurai-Amano, "Automated detection of road intersections from ERS-SAR imagery", Proc. IGARSS'95, pp.676-678, Florence, Italy, 1995.
- J.lisaka, T.Sakurai-Amano, S.Moresoli, "Automated road and trail detection from tropical region SAR imagery", PROC. GIS'96, Vancouver, Canada, 1996.
- J.lisaka and T.Sakurai-Amano, "Automated GCP detectionfor SAR imagery. I, Road intersection", Proc. SPIE Conference 2818, Denver, Coloarado, USA, 1996.
- J.lisaka and T.Sakurai-Amano, "PC Network of image computing for remote sensing", Proc. Symp. N global Environmental monitoring from space" pp-56-66Tokyo, Japan, 1984.
- L.M. Murphy, "Linear feature detection and enhancement in noisy images via the Radon transform", Pattern Regognition Lett.,vol.4No. 4,pp.279-284,1984.
- K. Eldhuset. "Automated ship and ship wake detection in spaceborne SAR imagesfrom coastal regions", Proc.-IGARESS'88, Edinburg, Scotland, 1988.
- K.Eldhuset, "Principles and performance of an automated ship detection system for SAR images," Proc. IGARSS'88, Edinburg, Scotland, 1988.
- R.F. Gasparovic, D.R. Thomson, and J.R. Apel, "Synthetic aperture radar imaging of ship-generated internal waves", John Hopkins APL Tech. Dig. Vo; no.4, pp.326-331, 1989.
- M.R. Rey, J.K.E. Tunaley, J.T. Folinsbee, P.A. Jahans, J.A. Dixon, and M.R. Vant "Application of Radon transform techniques to wake detection in SEASAT-A SAR images", IEEEE. Trans. Geosci, Remote Sensing, Vol. 28. pp. 553-560.1990.
- A.C. Copeland, G.Ravichandran, M.H. Trivedi, "Localized Randon transform-based detection of ship wakes in SAR image", IEEE Trnas. Geosci, And Remote Sens., vol.33, no.1pp.35-45, 1995.
- J.lisaka and T.Skurai-Amano, "Terrain featue recognition for SAR imagery employing spatial attributes of targets", Proc ISPRS Commission III Symp. Vo; 2357-399-408, Munich, Germany, 1994.
- J.lisaka and T.Sakurai-Amano, "Automated terrain feature detection from remotely sensed images integrating spectral, spatial and geometrical attributes of object", Proc. GIS/LIS'95, PP. 486-495, Nashville, USA, 1995.
- T.Sakuri-Amano and J.lisaka, "Small feature preserving speckle reduction High level image product", MPO Technical Report, No. 297-94, Canada Centre for Remote Sensing, Ottawa, Canada, 1994.
- J.lisaka and T.Sakurai-Amano, "A shape-based object recognition for remote sensing", Proc.. IGARSS'95, pp. 160-162, Florence, Italy, 1995.
- J.lisaka, "Structural spatial information extraction from remotely sensed data", Proc. IGARSS'89, pp. 1224-1227, Vancouver, Canada, 1989.
- R.O. Duda and P.E.Hart, "Use of the Hough transform applied to detect lines and curves in pictures", Comm. ACM, vol. 15, no. 1 pp11-15, 1972.
- D.E. Goldberg, "Genetic Algorthms in Search, Optimization, and Machine Learning, Addison Wesley, New York, 1989.