| GISdevelopment.net ---> AARS ---> ACRS 1996 ---> Agriculture / Soil |
Assessing Irrigation
Performance of Rice-Based Bhadra Project in India
S.
Thiruvengadachari
Group Director
National Remote Sensing Agency Hyderabad, India, and
R. Sakthivadivel, Senior Irrigation Specialist,
International Irrigation Management Institute, Sri Lanka
Abstract Group Director
National Remote Sensing Agency Hyderabad, India, and
R. Sakthivadivel, Senior Irrigation Specialist,
International Irrigation Management Institute, Sri Lanka
The study in Bhadra Project in India is an attempt to use a package of satellite remote sensing applications to assess agricultural system performance of rice-base irrigation system. Multi-year satellite data have been analyzed to provided disaggregated information on the irrigated area, cropping pattern and rice productivity. This spatial and temporal information has helped in evaluating the agricultural system performance through the years and across the helped in evaluating the agricultural system performance through the years and across the irrigation scheme. Problem pockets with limitations with regard to irrigation intensity, rice productivity and equity have been identified for follow-up action toward improved performance. This irrigation scheme, after rehabilitation under the National Water Management Project (NWMP), has shown significant improvement in the extent of irrigation as well as in the agricultural productivity.
The unit cost of SRS application in this irrigation scheme of 100,000 size works out to 10 develop appropriate vegetation index which is optimally sensitive to rice characteristics rather than to the background as well as improvement in the spectral modeling of rice yield.
Introduction
Performance assessment has been prioritized as most critical element to improve irrigation management (Abernethy and Pearce, 1987). Though remote sensing was identified as a tool to assess performance more than a decade ago (Abernethy and Pearce, 1987), the actual applications have been very few so far. Many early applications focuses on mapping irrigated crop lands (Huston and Titus, 1975; Draeger, 1976; Wall, 1979; Thiruvengadachari, 1981) and have continued till recent years, though with increased inventory capabilities with regard to irrigated area from different sources (Thiruvengadachari, 1983), crop type and crop stress (Azzalli and Menenti, 1989) and to monitoring temporal changes in irrigated area (Nageswara Rao and Mohan Kumar, 1994).
This study in Bhadra Project in India is perhaps the first attempt to use a package of satellite remote sensing applications for desegregated inventory through a number of years of irrigated area, cropping pattern, and estimating major crop (paddy) productivity to develop agricultural system performance indicators. Diagnostic analysis of selected poorly performing pockets of command area complemented the performance assessment. The study involved application of known procedures in an operational context as well as extension and innovative improvement of these techniques to address field complexities.
Bhadra Project
The Bhadra Project is located on the Bhadra River, a tributary of the Krishna River, in the state of Karnataka, India. The project comprises a dam with a gross storage capacity of 2025 Mm3, a Left Bank Canal serving 8290 hcctares (ha) and a Right Bank canal serving 92,360 ha. The Bhadra dam is situated 50 km upstream of the point where the Bhadra River joins Tungabhadra, another tributary of Krishna, and intercepts a catchment of almost 2000 km2 (Figure 1).
Figure 1 Location of the Bhadra Project command area
The long term average annual precipitation is 827 mm. Although the Bhadra basin gets rainfall during both southwest and northeast monsoon period. Sixty percent of the command is under red soil while the balance is under block soils. The mean annual potential evapotranspiration has been estimated as 1678 mm.
The project was designed to irrigate semi-dry crops that were to occupy more than 60 percent of its command area, with an overall annual cropping intensity of 200 percent. But as agricultural development progressed, it was found that ponded rice dominated to the extend of occupying 90 percent of the irrigated land on the Left Bank and about 56 percent on the Right Bank.
The heavy demand for rice led to inequitable use of the irrigation supply, and resulted in the rapid deterioration of the irrigation system as farmers intervened to modify the water management plan. This not only threatened the physical collapse of the system but also provoked dissatisfaction among till-end farmer. As a results, this scheme was taken up under NWMP to rehabilitate and provide more equitable, predictable and reliable irrigation service to result in improved agricultural productivity and farm income.
Salellite Data
High resolution data from Landsat 5 and Indian Remote Sensing Satellites (IRS IA and IB) ere used to monitor the agriculture system through 1986-87 to 1993-94 rabi (post-monsoon) seasons Hyderabad and has been processed at NRSA facilities in Hyderabad.
IRS Linear Imaging Self Scanning Sensor (LISSI) data of 72.5 m spatial resolution and Landsat multispectral Scanner (MSS) data of 80 m resolution and Thematic Mapper data of 30 m resolution were analyzed. To maintain consistency in the results generated through the years, LISSI and MSS sensor data having similar spatial resolution were selected for analysis.
Overview of Data Analysis
The analysis of satellite data following aspects:
- Mapping of irrigated crop areas and discrimination of rice from other cropped areas.
- Mapping spatial variability of rice transplantation-period across the command area through an innovative approach.
- Rice yield estimation through spectral index-yield models.
- Improved design for selection representative sample areas where yield data are measured based on satellite derived data on rice condition.
- Evaluation of impact of reported waterlogging on rice productivity.
A Geographic Information System (GIS) was developed at two levels of command area and for selected distributors fir evaluating the system performance and to diagnose and analyze the poorly performing distributors.
The Bhadra irrigation system is characterized by major area under ponded rice followed by semidry crops, sugarcane and garden crops and rice transplantation is also staggered over a period of more than a month and semi-dry crops being sown considerably earlier to rice. In view of this heterogeneity in crop calendar, both in order to obtain complete estimate of area under any crop as well as to ensure better discriminability, satellite data of 2 dates one at the time of maximum ground cover and canopy growth and another earlier data when paddy is being transplanted with semi-dry crops already sufficiently grown, during the irrigation season were analyzed. After a review of alternate classification approaches, a multivariate classification approach with two dates data merged into a single multi-channel data set was attempted. To maintain acceptable accuracy even at distributary level, final classification consisted of only rice and non-rice crops. The post classification check through field visits in more than 300 randomly selected points validated the classification accuracy to be 90 to 95 percent. Distributary level crop area statistics were extracted by digially overlaying the base maps of the command area on geometrically rectified crop classification map.
Spatial information on transplantation time for rice across the command area has been mapped, and illustrated in Figure 2. The seasonal NDVI (defined as the ratio of difference in red and near infrared reflectance to their sum) profile of every pixel of rice crop was analyzed to identify the peaqk-greenness stage. The knowledge that this corresponds on spatial staggering of rice transplantation. This is useful for evaluating the compatibility between canal delivery schedule and rice crop calendar at the distributary level.
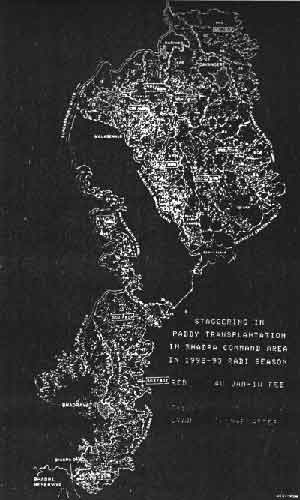
Figure 2 Spatial variability in rice transplantation
In the Bhadra Project study, normalized Difference Vegetation Index (NDVI) has been used to correlate with rice yield. A simple rice yield model was developed based on relationship between peak NDVI at heading stage of crop to the yield at 72 plots obtained through crop cutting experiments during 1992-93 rabi season level.
In the Bhadra Project study, normalized Difference Vegetation Index (NDVI) has been used to correlate with rice yield model was developed based on relationship between peak NDVI at heading stage of crop to the yield at 72 plots obtained through crop cutting experiments during 1992-93 rabi season.
Since rice transplantation is staggered across the command area, satellite data of any one data does not represent the same growth stage at all locations. An innovative approach of time composition was attempted, in which the maximum NDVI value for each rice pixel was picked from the satellite overpass enveloping paddy transplantation period. NDVI is the highest at the heading stage of rice crop. The rice yield model is defined as yield (kg/ha) = 42.23 TCVI -3439, where TCVI-time compo sited NDVI derived from IRS LISSI data. The TCVI for every pixel is the maximum NDVI value reflected from coregistered multidate satellite data enveloping the heading stage. The fractional maximum NDVI is multiplied by 400 to transform into the dynamic range of 0 to 255. The yield model developed from satellite and ground data of 1992-93 rabi season has been validated during 1993-94 rabi season, and the maximum deviation from observed crop cutting experiment yield values was less than 10 percent indication the stability of the yield model.
The rice yield model is currently location and time specific, since difference in rice variety, atmospheric effects and fertilizer-vegetative growth relationship may require modification of model coefficients.
System Performance Evaluation
Primary data on agricultural productivity (cropping pattern and rice yield) have been generated at distributary and reach levels from satellite data for rabi seasons from 1986-87 to 193-94 (Tables 1,2 and 3) and the improvement on system performance after NWMP implemnetation has been evaluated (Table 4). The tables indicate that irrigation intensity has increased in every sector of the command area, and distributarties with less than 50 percent irrigation intensity are almost negligible. Also, rice production has grown not only in terms of cultivated area, but also in yield level and production. Although rice was to be precluded and semi-dry crops encouraged during the rabi season under the NWMP, the case study found that irrigation intensity during the rabi season increased from 76 percent to 91 percent, rice area from 56 percent to 69 percent, and rice yield from 3.8 tonnes/ha to 4.9 tones/ha during the above period.
| Division | Planned Command(ha) | Irrigated Area (ha.) | |||||
| 1986-87 | 1987-88 | 1988-89 | 1989-90 | 1992-93 | 1993-94 | ||
| Davangere Malebennur Bhadravathi |
45,280 35,030 17,050 |
33,838 (75) 28,242 (81) 11,449* (67) |
15,848 (35) 23,260 (36) 5,856* (34) |
31,760 (70) 23,260 (66) 13,945* (82) |
31,760 (69) 31,738 (91) 13,311* (78) |
31,038 (87) 31,738 (91) 17,250* (101) |
39,436 (84) 30,610 (87) 15,695 (92) |
| Total | 97,360 | 73,529(76) | 34,381(35) | 68,965(71) | 67,366(69) | 88,424(91) | 84,412(87) |
| *As per ground data; all
others are satellite based. Note : Figure within brackets represent irrigation intensity in percdcent. | |||||||
| Division / Subdivision | Percentage of rice area | ||||
| 1986-87 | 1988-89 | 1989-90 | 1992-93 | 1993-94 | |
| Subdivions 1 Subdivions 2 Subdivions 3 Subdivions 4 |
45 54 59 42 |
39 49 57 37 |
23 40 44 35 |
51 67 78 63 |
60 69 78 74 |
| Davangere Division | 51 | 46 | 35 | 66 | 71 |
| Subdivions 1 Subdivions 2 Subdivions 3 Subdivions 4 |
72 56 59 61 |
83 33 61 42 |
90 46 60 79 |
88 66 73 77 |
83 54 75 72 |
| Malebennur Division | 65 | 64 | 76 | 81 | 76 |
| Subdivions 1 Subdivions 2 Subdivions 3 |
60* 41* 36* |
53* 33* 33* |
21* 33* 34* |
61 61 49 |
64 53 30 |
| Bhadravathi Division | 48* | 51 | 46* | 58 | 49 |
| Total command | 56 | 53 | 51 | 69 | 69 |
| * As per ground data. | |||||
| Division/Subdivisi on | Yield (tones/ha) | |||
| 1986-87 | 1989-90 | 1992-93 | 1993-94 | |
| Subdivions 1 Subdivions 2 Subdivions 3 |
2.4 3.7 3.4 |
4.5 4.7 4.2 |
3.8 4.1 3.8 |
4.2 4.2 4.6 |
| Bhadravathi division | 3.2 | 4.6 | 4.0 | 4.3 |
| Subdivions 1 Subdivions 2 Subdivions 3 Subdivions 4 |
4.3 3.3 4.1 3.7 |
6.1 5.0 6.0 5.7 |
5.8 4.0 4.9 4.9 |
56 4.5 52 52 |
| Malebennur Division | 4.1 | 5.9 | 5.3 | 5.3 |
| Subdivions 1 Subdivions 2 Subdivions 3 Subdivions 4 |
3.8 4.0 3.7 3.4 |
4.9 5.2 4.5 5.2 |
4.0 4.5 4.4 4.5 |
4.8 4.6 4.4 4.9 |
| Davangere division | 3.8 | 5.1 | 4.4 | 4.6 |
| Total command | 3.8 | 5.4 | 4.7 | 4.9 |
| Notes: 1986-87 Rabi pre-NWMP
and no cutoff. 1989-90 Rabi with 25 percent command area cutoff from irrigation 1992-93 Rabi without cutoff. 1993-94 Rabi without cutoff. | ||||
The projects performance before and after NWMP implementation in 1988 is shown in table 4. Other performance indicators such as depth of water application and rice production per unit of water can be derived from satellite data in conjunction with ground. The water delivery is measured at the off take point of the distributary. The system losses in the distributary have not been accounted for. The equity of the water supply is measured through Christiansen's Uniformity Coefficient (UCC) which is estimated as the ratio of the weighted sum of deviations of the depth of water supply from the mean and the mean depth of water supply (Table 5).
| Parameters | Rabi season | |||
| 1986-87 | 1989-90 | 1992-93 | 1993-94 | |
| Irrigated crop area
(ha) Percentage of rice area Average rice (rough rice) yield (tones/ha) Depth of water application (m/ha) Area irrigated per unit volume of water (ha/ha.m) Rice (rough rice) output per unit of land (tones/ha) Rice (rough rice output per unit volume of water (tones/m3) |
73,529 56 3.8 1.06 0.94 3.8 0.3 |
67,366 51 5.4 1.04 0.96 5.4 0.4 |
88,424 69 4.7 0.80 1.25 4.7 0.5 |
84,41 69 4.9 0.86 1.16 4.9 0.5 |
| Branch Canal | Christiansen's Uniformity Coefficient among : | ||||
| Sub division | Distributaries | ||||
| Sub - distributary 1 | Sub - distributary 2 | Sub - distributary 3 | Sub - distributary 4 | ||
| Bhadravathi Malebennur Davangere |
0.75 0.93 0.919 |
0.91 0.85 0.66 |
0.80 - 0.84 |
0.75 0.69 0.93 |
- - 0.89 |
The performance of the Bhadra Project through the years has shown significant improvement in regard to area irrigated, agricultural productivity and equity of distribution. Only a few pockets of inequity remain to be improved by the management.
Cost Effectiveness of SRS Techniques
Satellite remote sensing application to disaggreated irrigation inventory in Bhadra Project of 100, 000 ha size costs about 10 U.S. cents per ha for each irrigation season at 1994-95 price level. This includes the cost of satellite data, analysis and statistics generation. The unit cost decreases to about 3 U.S. cents per ha for irrigation schemes larger than 250,000 ha due to economy o scale. Similar unit cost for monitoring waterlogging and soil salinity status work out to 5 U.S. cents per ha and 2 U.S. cents per ha respectively, when attempted along with crop inventory. The SRS application cost works out to about 1 to 2 percent of annual operation and maintenance costs for irrigation schemes in India.
Conclusions
The Bhadra study has demonstrated the potential and cost-effectiveness of SRS techniques for inventorying and monitoring agricultural productivity in a large irrigation system in India. Effective integration of GIS with SRS techniques further enhances performance evaluation and diagnostic analysis capabilities.
The study also points out the need to focus on development of appropriate vegetation index for rice and improved spectral yield models.
References
- Abernethy, C.L.; and Pearce, G.R. 1987. Research needs in third world irrigation, Hydraulics Research Limited, Wallingford, England.
- Azzali, S.; and Menenti, M. 1989. Irrigation water management in two Italian irrigation districts. Proc. Workshop on Earthnet Pilot Project on LANDSAT-TM application Frascati, Italy. Pp 41-48.
- Draeger, W.C. 1976. Monitoring irrigated level acreage using Landsat imagery: an application example. Open-file report No. 76-630. U.S. Geological Survey. Pp. 23.
- Huston, D.M.; and Titus, S.J. 1975. An inventory of irrigated lands within the State of California based on lands and supporting aircraft data. Space sciences laboratory series 16, issue 56, University of California, Berkeley. Pp. 23.
- International Irrigation Management Institute (IIMI). 1996. Tools for research in basin management. Proposal submitted to the Government of Netherlands for funding. Colombo, Sri Lanka: IIMI.
- Nageswara Rao, P.P.; and Mohan Kumar, A. 1994. Cropland inventory in the command area of Krishnarajasagar project using satellite data. Int. J. Remote Sensing, Vol. 15, No. 6: 1295-1305.
- Thiruvengadachari, S. 1981. Satellite sensing of irrigation pattern in semi-arid areas: an India study. Photograpmmetric Engineering and Remote Sensing of the Environment, Ann Arbor, USA: 369-397.
- Thiruvengadachari, S. 1981. Satellite sensing of irrigation pattern in semi-arid areas: An India study. Photogrammetric Engineering and Remote Sensing, 47:1493-1499.
- Wall, S.L. 1979. California's irrigated lands, Symposium on identifying irrigated lands using remote sensing techniques: Sate-of-art. Sioux Falls, USA, USA 71-75.