| GISdevelopment.net ---> AARS ---> ACRS 1996 ---> Agriculture / Soil |
Rice Crop Monitoring in
Zhaoqing, China using RADARSAT SAR - Initial Results
Gordon C. Staples and Jeff
Hurley
RADARSAT International
Richmond, British Columbia
Canada
Email : gstaples@rsi.ca
AbstractRADARSAT International
Richmond, British Columbia
Canada
Email : gstaples@rsi.ca
RADARSAT Standard mode imagery of Zhaoqing, China was acquired on march 5 and June 10, 1996. The acquisitions were during the Early-rice regional cropping calendar, with the first acquisition during the sowing stage, and the second acquisition during the heading stage. Rice and banana crops, aquaculture ponds, and urban area land-use classes were identified. Aquaculture ponds used for the production of fish and ducks had no significant backscatter change between acquisitions, but ponds used for growing gorgon euryale showed a significant backscatter increase. Rice paddies were also identified. The backscatter change for the rice paddies was variable, and was attributed to inhomogeneous growing conditions and variability of the vegetative phase. The growth stage between tillering and heading was identified as a key period for image acquisition if the rice-yield estimates are required.
1.0 Introduction
RADARSAT, which was lunched in November 1995, is equipped with a C-band HH-polarized synthetic aperture radar (SAR). One of the potential applications for RADARSAT imagery is for operational rice monitoring. With RADARSAT, a number of key requirements to bring this application to an operational level are readily attainable. These requirements include. (1) SAR backscatter, which is sensitive to plant type and growth (Brown et al., 1993), and has been shown to responsive to rice growth and development (Le Toan et al., 1989 & 1995; Kurosu et al., 1995; Aschbacher and Paudyal, 1993); (2) SAR is relatively insensitive to atmospheric effects, so image acquisition is weather independent; and (3) RADARSATs variable incidence angel and beam modes dramatically increase the re-visit frequency, and provide variable resolutions (RSI, 1995; Raney et al., 1993).
The objectives of this study were to assess the ability of RADARSAT to discriminate land-use classes, and to better understand the backscatter response as a function of the rice crop growth. The backscatter as a function of time is required so future, multitemporal acquisitions, can be planned to coincide with rice-growth stages based on knowledge of the local cropping calendar. The Zhaoqing test site was selected because it was also a test site during the GlobeSAR program (Ryerson et al., 1994). During the GlobeSAR program, airborne radar imagery was acquired and ground truth information was collected. The ground truth information was used to interpret the RADARSAT imagery.
2. The Study Area
Sihui County, in the province of Guangdong, is located in the southeast corner of China, in the Southern Uplands geographic region. This region is fairly mountainous with the only level terrain located in the delta of the River Xijiang. Rainfall in the southeast corner is the heaviest in China, averaging 100 to 200 cm per year, which is suitable for rain-fed, double-cropping of rice. In Guangdong province, attempts have been made to grow as many as there crops per year, but in terms of the added resources required, the addition of a third crop has not proved economical (Barker et al., 1985).
The double cropping system consists of Early rice and Late rice. Sowing for Early rice begins in March with harvest in early July. In the case of Late rice, sowing begins in early July with harvest in early November. The cropping calendar (Typical dates) for Early rice is shown in Table 1. Inter annual variability for both Early rice and Late rice does occur, with deviations that are largely related to the availability of water.
| Sowing | Transplanting | First Tillering | Heading | Harvest |
| March 1 (March 5) | April 11 | April 21 | June 11 (June 10) | July 11 |
3.0 Data
3.1 RADARSAT imagery
RADARSAT Standard 5 (S5) beam mode imagery was acquired in descending node on March 5 and June 10, 1996. The data were recorded on one of RADARSAT's on-board recorders, and downlinked for processing at the Canadian Data processing Facility in gatineau, Quebec. The data were processed to Path Image level (RSI, 1995). The RADARSAT Standard beam modes have nominal image coverage of 100 km x 100 km, 25 m resolution, and incidence angles that range from 20o to 49o.For the S5 mode, the range resolution varies between 23.6 m in near range to 20.7 m in far range, with 27 m nominal azimuth resolution (4 looks). The incidence angel varies from 36o in near range to 42o in far range.
3.2 Image Analysis Methodology
Manipulation of the imagery was performed using PCI's EASI/PACE software on a SunSPARC Station 20. All images were read from CEOS format using the EASI/PACE RADARSAT autoloading functionality.
The original format of all files was 16-bit unsigned, with gave a possible range of Digital Numbers (DN) of 0 to 655335. To reduce the working size of these files, and to prepare the images for printing and file export, each image was scaled to 8-bit unsigned date with a 0-255 DN range.
The merging of the images was accomplished using PCI's GCPWorks. The images were not geocoded individually, but each image was geolocated relative to the first Standard Beam image. The process is more commonly known as image-to-image correction. The Standarh mode image acquired March 5 was used as a baseline, and the second image (June 10) was geolocated to the first image. A total of thirteen ground control points were used resulting in a root-mean-square error of less than half a pixel in the x and y direction. A first-order transformation with cubic resampling was used.
4.0 Result and Observations
In a previous study of RADARSAT-simulated imagery of Zhaoqing, ground truth information provided by the Institute of Remote Sensing Application was used to classify land use and identify rice crops (Staples et al., 1994). In the 1994 study, mature wetaland rice, in the ripening growth stage and ready for harvest, and stubble (harvested rice) were identified. In addition, banana crops, urban areas, and aqaculture ponds were fish and duchs are raised were noted. Some of the aquaculture ponds are also used to grow gorgon euryale, a plant used for medical purposes. Based on the same ground-truth information, both of the RADARSAT Standard 5 images acquired in 1996, showed the same land-use classes identified in the RADARSAT-simultated imagery.
The March 5, 1996 Standard 5 RADARSAT image (subscence) is shown in Figure 1. The image size is 19 km 2 14 km. Rice paddies ®, aquaculture ponds (P), and banana crops (B) are marked. Other features in the March 5 image include the town of Gangli (G), the Lankeshan Uplands (U), the River Xijiang (X). The largest separation of DN values was between the ponds and the urban areas. The ponds were characterized with a mean DN of 30, and the urban areas with a mean DN of 185. This separation is not surprising given the characteristically strong radar backscatter due to corner-reflector response from building, and the weak backscatter due to secular reflection from the surface of the ponds (and the River Xijiang).
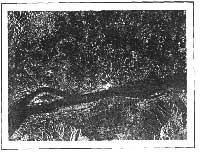
Figure 1. RADARSAT Standard Mode image (subscene) of Zhaoqing acquired March 5, 1996. Rice paddies ®, aquaculture ponds (P), banana crops (B), Lankeshan Uplands (UP, River Xijiang (X), and the town of Gangli (G) are indicated. Image size is 19 km x 14 km.
Subscenes of the Standard 5 imagery acquired march 5 and Jun3 10, 1996 are shown in Figure 2a and 2b. For botyh scenes, the image size is 11 km x 9 km. For comparison, these areas correspond to upper left-hand corner of Figure 1. In these images, three land-use classes were noted. Using the same lettering convening, rice crops® and aquaculture ponds (P) were identified, and in addition, aquaculture ponds, where a significant change in the backscatter occurred, were identified with the delta (D) symbol.
In the P-ponds, there was no significant change in the backscatter between the two acquisition dates. The DN remained essentially constant, with a mean value of 30 for both dates. The constant backscatter was attributed to the type of aquaculture activity, namely the production of fish and ducks. In this case, there was no (significant) change in the surface roughness, and therefore, little change in the radar backscatter. In both images, low backscatter was evident by the dark tones.
In contrast to the P-ponds, there was a significant change in the backscatter for the D-ponds. In the D-pond case, the mean DN was similar to the mean DN of P-ponds for the March 5 image, but the mean DN for the June 10 image had a value of 115. The change in the DN value was attriubuted to the growth of the gorgon euryale plant on the surface of the ponds. Presumably, this type of plant germinates in the subsurface stratum, but eventually grows through the pond surface, and also spreads across the pond surface. The plants on the pond surface produce volume scatter in, and hence increase the backscatter. In the March 5 image, the D-ponds had dark tones, but in the June 10 image, the D-ponds had brighter tones.
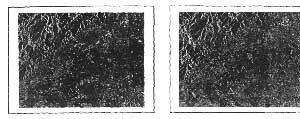
Figure 2a & 2b. RADARSAT Standard Mode imagery (subscenes) acquired March 5 (left) and June 10 (right), 1996. Rice paddies ® and aquaculture ponds (P-no significant change in backscatter) and aquaculture ponds (D-significant change in vackscatter) and indicated. Both images are 11 km x 9 km.
The variation of rice-crop backscatter is well documented (Le Toan et al., 1989 & 1995; Kurosu et al., 1995; Aschbacher and Paudyal, 1993). During the fallow growth stage the radar backscatter is a runction of the soil roughness, plant corner reflections between the wet soil and the stubble, creating bright image returns. During the folooding stage, specular scattering from the water surface results in low radar backscatter. As the plants tiller and grow, they expand both horizontally and vertically, eventually covering the water surface. During this vegetative growth phase the radar surface. The radar backscatter peaks during this growth stage with the plant growth is at a maximum. As the crop ripens, the plant water-content decreases with causes a decrease in the radar backscatter. The backscatter reaches a minimum just prior to harvest.
Rice paddies ® were readily identified in the RADARST imagery, largely due to tone and texture variations as compared to other crops. The change of DN values, however, for the rice paddies between the march 5 and the June acquisition. The variability was attributed to the timing of the RADARST acquisition relative to the cropping calendar, and inhomogeneous growing conditions (see Table 1.) The march 5 image was acquired during the sowing stage, when the backscatter is a function of the field and soil conditions, and therefore variable. During the transplanting stage, when the backscatter is a function of the field and soil conditions, and therefore variable. During the transplanting stage, when the fields are flooded, a significant decrease in the backscatter is expected, but the next RADARST acquisition was not until June 10 (the heading stage). Although radar backscatter should be near, or slightly below maximum at the time of the heading state, inhomogeneous growing conditions, in combination with variation in the vegetative phase, were likely a contributing factor in the observed backscatter variability. As noted by Malingreau (1986), the vegetative phase determines the total duration of the rice crop life cycle, since the reproductive phase is of more or less constant duration for all rice for all rice varieties.
5.0 Conclusion and Future Work
RADARST Standard Mode imagery of Zhaoqing, China, when merged with ground truth information was used to identify rice crops, aquaculture ponds, banana crops, and urban areas. It is evident that RADARST has both the radiometric and geometric resolution for land-use discrimination. For rice crop monitoring, however, an adequate time series of data is required, and is addition, knowledge of the regional cropping calendar is also required. If RADARSAT imagery is to be used to produce estimates of the total rice crop acreage for a given area, or for the production of rice crop yield forecasts, then more work is required, but the potential for rice crop monitoring is strong.
The intent of this paper was present early results on the use RADARSAT for rice crop monitoring. Although the two images analyzed provided a solid starting point, more analysis and additional image acquisitions are required. Image acquisition must be planned to coincide with the rice crop growth stages. Acquisitions during the sowing stage would allow the discrimination between ponds and rice paddies, and in particular to provide discrimination (required at a later date) between the ponds where the gorgon euryale plants are grown and the vegetating rice crops. During the flooding stages, the low backscatter would provide a benchmark to monitor the backscatter change. The key acquisition period is between the tillering and heading stage. During this time frame, the backscatter will be maximum, and if the backscatter is related to a rice-crop yield mode, then yield predictions can be calculated in advance of the rice harvest.
Acknowledgements
Dr. Chao Wang, Institute of Remote Sensing Application, Beijin, China, provided the ground truth information for interpretation of the RADARSAT imagery and the rice cropping calendar for the Zhaoqing region. The RADARSAT imagery was provided by and is a copyright of the Canadian Space Agency. Data reception was provided by the Canada Centre for Remote Sensing and data processing by RADARSAT International.
References
- Aschbacher, Josef, D. Paudyal, Studies of rice in Thailand using ERS-1 data. Proceedings National Conference on ERS-1/Landsat/SPOT Applications: A complimentary Approach, 23-25 November, 1993,Jakarta, Indonesia.
- Barker, Randolph, Robert W.Herdt, and Beth Rose, The Rice Economy of Asia, McGraw-Hill, New Yrok, 324 pp., 1995.
- Brown, R.J., B. Brisco. F.J. Ahem, C.Bjerkelund, M. Manore, T.J. Pultz, and V. Singhory, SAR application Calibration Requiremnets, Can. J. of Rem. Sens., Vol. 19, No. 3, 1993.
- Kurosu, Takashi, T. Suitz, M. Fuijita, K. Chiba, and T. Moriya, Monitoring of Rice Crop Growth from Space using ERS-1 C-band SAR, IEEE Trans. Geosci. And Rem. Sens., Vol. 33, No. 4, pp. pp. 1092-1096, 1995.
- Le Toan, T., F. Ribbes, T. Rabaute, P. Puyou Lascassies, M.Marsoedi, and M.Mubekti, Assessment of Rice using ERS-1 SAR; The SARI Project, Conference on Remote Sensing and GIS for Environmental Resource Management: The Indonesian-European Experience, Jakarta, June 6-8,1995.
- Le Toan, T., H. Laur, E. Mougin, and A. Lopes, Multitemporal and Dual Polarization Observations of Agricultural Vegetation covers by X-band SAR Images, IEEE Trans. Geosci and Remote Sens., Vol. 27. No. 6, pp. 709-718, 1989.
- Malingreau, Jean-Paul, "Monitoring tropical wetland rice production system: A test for orbitial remote sensing", in Remote sensing and tropical and management, Edited by M.J. Eden, J.T.Parry, John Wiley and Sons, New York, 1986.
- Raney, R. A. Luscombe, E. Lagham, and S.Ahmed, "RADARSAT", Proceedings of the IEEE, Vol. 79, No. 6, June, 1991.
- RSI, RADARSAT Illuminated -Your Guide to Products and Services, RADARSAT International, Richmond, Canda, 1995.
- Ryerson, R.A., F.Campbell, R.Brown, and D.Lapp, GlobeSAR: Acanadian Remote Sensing Program, Processings 15th, Asian Conference on Remote Sensing, Bangalore, India, November 17-23, 1994
- Staples, G.C.,S. Rossignol, D. Nazarenko, G. Elms, C. Wang, H. Guo, R. Brown, and B. Brisco, Rice Crop Monitoring using RADARSAT simulated AR Imagery, Proceedings 15th Asian Conference on Remote Sensing, pp. 1-5, Vol I, Bangalore, India, November, 1994.