| GISdevelopment.net ---> AARS ---> ACRS 1995 ---> Spatial Information Processing |
Contour Line Interpolation by
using Buffering Method
Masataka Takagi and
Ryousuke Shibasaki
Institute of Industrial Science,
The University of Tokyo. 7-22, Roppongi, Minato-ku,
Tokyo 106, Japan
E-mail : mural1@shunji.iis.u-tokyo.ac.jp
Tel. +81-3-3402-6231 Fax. +81-3-3479-2762
Abstract
Institute of Industrial Science,
The University of Tokyo. 7-22, Roppongi, Minato-ku,
Tokyo 106, Japan
E-mail : mural1@shunji.iis.u-tokyo.ac.jp
Tel. +81-3-3402-6231 Fax. +81-3-3479-2762
For regional DEM (Digital Elevation Model) generation, an interpolation method becomes very helpful. We developed new reliable interpolation method which based on an intermediate contour line generation. The intermediate contour line can be drawn by using a buffering method. The buffering is a very popular technique in GIS (Geological Information System), which can be calculated distance from any points, vectors or polygons.
This paper presents a methodology of buffering method. And the results were compared with existing methods. Items for comparison are elevation, inclination, aspect and undulation. The developed method gave the best results in all items.
Moreover, a relationship between a contour interval and an accuracy of generated DEM was concluded. The results showed a ratio of pixels of contour line in the whole raster map image must be more than 20%.
1. Introduction
Nowadays, there are many kinds of DEM (Digital Elevation Model) generation methods such as a stereo-matching from aerial photograph or satellite image, an interferemetry from stereo SAR data and an interpolation of topographic maps. For regional DEM or continental DEM generation, the interpolation method using small scale contour maps becomes very helpful. However, almost existing methods of the interpolation are intended for large scale contour maps. Small scale contour maps have some problems which a form of contour line is often much different from the neighbor contour line, and contour line information is very few in low land area.
An objective DEM in this study is raster type. Usually, interpolation of contour line is calculated pixel by pixel. The most popular method of the interpolation is using a profile which include target pixel for elevation extraction. In this paper, this method is called "profile method". An elevation of the target pixel can be estimated by curve fitting from crossing points of contour line along the profile. Linear equation, polynomial equation, second order equation or Spline function is used as curve fitting equation. Figure 2 shows a shaded image of generated DEM from a test contour line map (Figure 1). A contour line interval was spread purposely in order to see reliability of the result. Spline function was used for curve fitting. In this image, there are many radiated noises which are along calculated profile. Searching the most suitable direction of profile is difficult in this method.
Figure 1 Contour line map
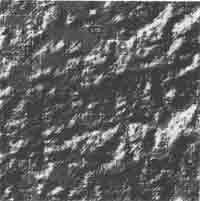
Figure 2 Shaded DEM from Profile method
Another popular method of the interpolation is using a window which a target pixel is located on the center. In this paper, this method is called "window method". Consisted pixels of contour lines in the window are used as random points. An elevation of the target pixel can be estimated by weighted mean calculation. Figure 3 shows a shaded image of generated DEM from the same contour line map (Figure 1). In this image, there are steep slope along the contour lines. And other area become flat. In this method, definition of weight and window size is difficult. And in case of complex form contour line, a detail can't be represented.

Figure 3 Shaded DEM from Window method
Therefore, more reliable method of the interpolation should be developed when rough contour line map is used. We attempted to develop a new method using buffering which is one of CIS techniques.in this paper, this method is called "buffering method". This paper presents the methodology of interpolation using buffering. And the results will be compared with existing methods. Items for comparison are elevation, inclination, aspect and undulation. Finally, a relationship between contour interval and an accuracy of generated DEM will be concluded.
2. Methodology
The buffering method is not calculate elevation at every pixel, which is based on an intermediate contour line generation. The intermediate contour line can be drawn by using buffering image. Buffering can represent distance from any points, vectors or polygons. In raster type data, distance is set to each pixel as an attribute. If we have lOOm and 2OOm contour line in the image, the distance from each contour line can be set to whole pixels (Figure 4). For example, gray level represents distance from contour line. Therefore, the intermediate contour line is located on same distance from each contour line. Figure 4 shows general idea of intermediate contour line generation. Same distance points from each contour line compose intermediate contour line. On the other hand, we have another easy process to draw intermediate contour line. It is based on making fat contour line. Every contour line is made fat by one pixel at a same time until whole pixels are fill with contour line value. Then, boundaries of the contour line become intermediate contour line. After that, new intermediate contour line can be drawn from previous intermediate contour line and original contour line. By iteration of this process, intermediate contour line should be drawn until whole pixels are fill with contour line.

Figure 4 General isea of intermediate contour line generation
By the way, the intermediate contour line generation can be applied in case of enclosed area with different contour line. Other area which enclosed with same contour line must be calculated by different method. Such area is corresponded to valley or ridge area. A buffering can also apply in such area. Figure 5 shows general idea of buffering result in enclosed area with 200m contour line. The buffering result can be seen like contour line itself. Therefore, same elevation can be given to same buffering pixels. In this method, the most important thing is definition of extreme value in the enclosed area. An undulation curve was used for extreme value estimation in this study. An undulation curve is expressed a relationship between radius from top of a mountain and the undulation which means difference between minimum elevation and maximum elevation. It is represented one of the topographical feature. If geological structure is homogeneity, the undulation curve becomes almost same with neighbor mountains. So, when acreage of enclosed area could be calculated, maximum elevation can be estimated. Moreover the enclosed area must be judged ridge or valley. Usually, when around contour line of the enclosed area is higher, the area is estimated valley. When around contour line is lower, the area is estimated ridge reversely. If there are some exceptions, some attributes layer must be attached to the contour image.
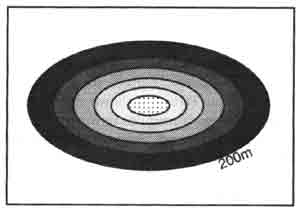
Figure 5 General idea of buffering results
A complete DEM can be generated from combination of previous two interpolated DEMs. This method doesn't need searching profile or definition of calculation window size. So, this will be more reliable method. Figure 6 shows shaded image of generated DEM by this method. In this figure, there are no noisy area.
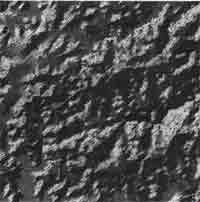
Figure 6 Shaded DEM from Buffering method
3. Evaluations of Buffering Method
Evaluations of buffering method were carried out by comparison with existing methods which are profile method and window method. And effects of contour line interval on DEM accuracy were concluded. Items for evaluation is not only elevation but also topographical feature such as slope gradient and slope aspect.
Verification data were generated from 5m grid DEM which were generated by profile method with the linear equation from 1:25000 topographical maps. The 5m grid DEM were resampled to 50m grid size by taking the average in order to make suitable DEM for verification. Moreover, slope gradient data and slope aspect data were generated from the verification DEM. lOOm, 200m, 300m and 400m interval contour line maps were created from the verification DEM. From those contour line maps, DEMs were generated by using each interpolation method.
3.1 Elevation Accuracy
An index of elevation accuracy is used percentages of correct pixels. In case of elevation evaluation, correct pixel means difference with verification DEM indicates inside of 20m. Figure 7 shows relationship between contour line interval and correct percentage in each method. In this figure, accuracy has tendency to drop with increasing contour interval. And buffering method is always located the highest accuracy in all contour intervals. Though window method shows almost same accuracy with buffering method in lOOm contour interval, the accuracy becomes 10% less in other contour intervals. Profile method shows the worst results, because radiated noises influence to accuracy
Figure 7 Relationship between contour line interval
3.2 Slope Gradient Accuracy
A slope gradient can be expressed from DEM, which is one of the most important items for topographical analysis. In this study, the slope mea n s maximum inclination angle at one target pixel. An index of slope gradient accuracy is also used percentages of correct pixels. In case of slope gradient accuracy,correct pixel means difference with verification slope gradient data indicates inside of 20 degree . figure 8.shows relationship between contour line interval and correct percentage in each method. Buffering method is always located the highest accuracy in all contour intervals. Though profile method shows almost same accuracy with buffering method in 100 m Contour line interval, the accuracy becomes 10% less in other contour intervals. The window method Shows the Worst results, because steep slope along contour line Influenced to accuracy .
Figure 8 Relationship between contour line interval and correct percentage of slope gradient
3.3 Slope Aspect Accuracy
A slope aspect can be expressed from DEM, which is one of the most important items for topographical analysis. In this study, the slope aspect Shows along the maximum inc inclination angle at one target pixel. An Index of slope aspect accuracy IS also used percentages of Correct pixels. In case of slope gradient accuracy, correct pixel means difference with verification slope gradient data indicates inside of 45 degree. Figure 9 Shows relationship between contour line interval and Correct percentage in each method. The Correct percentage Shows very lower than elevation or slope gradient, which is indicated less than 68%. However, buffering method is almost located the highest accuracy in all contour intervals.
Figure 9 Relationship between contour line interval and correct percentage of slope aspect
3. Conclusions
In this study, buffering method was developed for small scale maps. The developed method was compared with existing methods on elevation, slope gradient and slope aspect. In all items, the buffering method showed very good results.
Existing method had some problems in one items of topographical features. For example, profile method has much error in elevation value, because there are many errors along calculated profile. Window method has much error in slope gradient, because there are many errors along contour lines. Anyhow, existing methods didn't Show good results in case of wide contour intervals.
A contour line interval influenced accuracy of DEM. When contour line interval becomes over 300m, a Correct percentage becomes less than 50%. A percentage of pixels which are consisted contour line is about 10% in case of 300m contour interval. Moreover, in case of loom contour interval, the percentage becomes 30%. Therefore, 20% contour line information on whole map are required for reliable DEM generation.
In this paper, calculation speed was not evaluated. Actually, buffering method spends much time in comparison with existing two methods. However, if we need high accuracy DEMs, it will not be So serious problem. And Computer is progressing rapidly.
References
- Sukit Viseshsin and Shunji Murai (1990), "Automated Height Information Extraction from Existing Topographic Map", International Archives of Photogrammetry and Remote Sensing, Vol.28 Part 4, pp.338 -346
- Kiyonari Fukue, Yousuke Kuroda, Haruhisa Shimoda and Toshibumi Sakata (1990), " Simple DEM Generation Method from a Contour Image", International Archives of Photogrammetry and Remote Sensing, Vol.28 Part 4, pp.347 -355
- F. Ackermann (1994), " Digital Elevation Models -Techniques and Application, Quality Standards, Development", International Archives of Photogrammetry and Remote Sensing, V 01.30 Part 4, pp.421 -432