| GISdevelopment.net ---> AARS ---> ACRS 1995 ---> Water/Marine Resources |
Observation of western
Siberian Wetlands by using remote sensing techniques: Estimation of
methane emission
M. Tamura and Y.
Yasuoka
National Institute for Environmental Studies,
16-2 Onogawa, Tsukuba, Ibaraki, 305 Japan
K. Tokumura
Nakanihon Service, Air 2-3-15 Kyobashi, Chuou, Tokyo, 104 Japan
Phone : +81-298-50-2479; Fax: +81-298-51-4732;
E-mail: m-tamura@nies.go.jp
Abstract National Institute for Environmental Studies,
16-2 Onogawa, Tsukuba, Ibaraki, 305 Japan
K. Tokumura
Nakanihon Service, Air 2-3-15 Kyobashi, Chuou, Tokyo, 104 Japan
Phone : +81-298-50-2479; Fax: +81-298-51-4732;
E-mail: m-tamura@nies.go.jp
A SPOT/HRV image was obtained at Plotnikovo test site in western Siberian wetlands. The image area was classified into eight categories of ecosystems (birch forest, conifer forest, bog_1, bog_2, bog_3, water, grass and bare soil) using ground truth data and aerial photographs. Methane emission from the image area was estimated by combining the result of ecosystem classification and the methane flux data measured on the ground. This estimate of methane emission was in good agreement with the average estimate obtained from airborne methane measurements. The agreement shows the usefulness of remote sensing techniques in extrapolating ground methane flux measurements to a regional or global scale estimate of methane emissions.
I. Introduction
Western Siberian wetlands are presumed to be large sources of atmospheric methane, which is one of the most significant greenhouse gases, Recent Japan-Russia joint research Project conducted by our research institute and Russian co-workers is yielding the results supporting this resumption (Panikov, 1994). To evaluate the role of the western Siberian wetlands as sources of atmospheric methane, it is necessary to classify wetland ecosystems and to measure mean methane flux for each ecosystem type. In this research we investigate the vegetation in western Siberian wetlands by using remote sensing techniques and estimate regional methane emissions by combining the results of satellite observations with ground methane measurements. We use two categories of satellite sensors: a wide-coverage coarse-spatial-resolution sensor like NOAA/AVHRR and high-spatial-resolution sensors like SPOT/HRV and JERS-I/OPS & SAR. The former is used to estimate overall wetland distributions and to monitor the seasonal change of vegetation in the whole western Siberian wetlands. The latter is used to classify wetland ecosystems is selected test sites.
In this paper we analyze a SPO/HRV image at Plotnikovo test site in west Siberia to classify wetland ecosystems. Methane emission from the image area is estimated by combining the result of emission estimate with those obtained from airborne methane measurements.
II. SPOT/HRV image at Plotnikovo in western Siberian wetlands
A SPOT/HRV image was obtained at Plotnikovo test site on 8 July 1995. Plotnikovo settlement is located at the map coordinates (85o05'E, 56o51'N) in the basin of Ob' river and belong to the south east part of the western Siberian wetlands (see Figure I). The SPOT/HRV is a high resolution imaging system with a ground resolution of 20 m and has three spectral bands of green, red and near infrared wavelengths (0.50-0.59, 0.61-0.68 and 0.79-0.89 um). Figure 2 shows the SPOT/HRV image in the near infrared band. We selected this place as one of our test sites because ground observations of vegetation and atmospheric gasses have been made since 1993 by the Moscow Institute of Microbiology. Circle symbols in Figure 2 shows the locations of methods flux measurements.
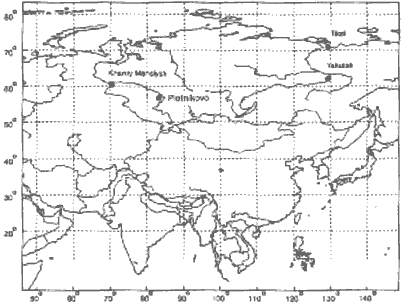
Figure 1: Location of Platnikovo
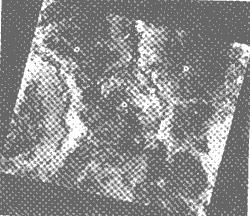
Figure 2: SPOT/HRV image at Plotnikovo. Circle symbols show ground measurement points of methane fluxes.
Based on the ground truth data and aerial photographs obtained in 1994 and 1995, we classified the land cover types in the image area into eight categories (birch forest, conifer forest, bog_1, bog_2, bog_3, water, grass and bare soil)using the supervised maximum likelihood classification technique. Figure 3 shows the result of land cover classification. Birch trees are dominant in forested areas and coniferous forests are found along rivers because soils have richer nutrients there. Bog_1 is identified as peat land with low pine trees and shrubs, bog_2 as peat land with sparse dwarf trees and shrubs, and bog_3 as peat land mainly with grasses such as sedges and cotton-grasses.
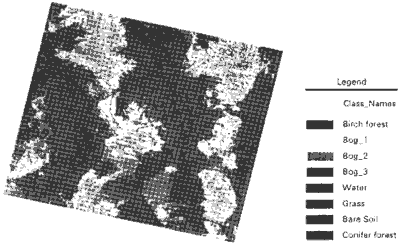
Figure 3: Result of land cover classification
III. Estimation of methane emission from the SPOT image area
To estimate the methane emission from the SPOT image are, we used the methane flux data measured on the ground by the Moscow Institute of Microbiology (Panikov, 1994). Table I shows the mean methane fluxes for the period from July to August in 1993 and 1994. The measurements for open bogs were made at three points 8indicated by circle symbols in Figure 2. The measurements for forested bogs were made outside of the SPOT image area.
| Site | No. of measurements | Mean | Standard dev. |
| Forested bogs Open bogs |
23 56 |
21.1 233.9 |
43.8 326.1 |
Table 2 shows the area size and areal ratio of each land cover type and the estimated methane emission. We calculated the methane emission by multiplying the mean methane flux with area size for each land cover type. We assumed that the means methane flux is the same for birch and conifer forests, i.e. 21.1 mg CH4 m-2 day-1 and also that the mean methane flux is the same for three types of bogs, i.e. 233.9 mg CH4 m-2 day-1. We neglected the contributions from water, grass and bare soil areas, because methane flux data are not available for these land cover types and their areal ratio is small (7% in total). The total methane emission from the SPOT image area was estimated as 432.7x10⁶ g CH4 day-1 and the mean methane flux in the SPOT image area was 102 mg CH4 m-2 day-1.
| Land cover types | Area (Km2) | Areal Ratio(%) | Methane flux (106 g CH4 day-1) |
| Birch forest Conifer forest Bog_1 Bog_2 Bog_3 Water Grass Bare soil |
515.0 788.6 818.8 417.2 406.3 28.5 251.1 15.1 |
35.7 18.6 19.3 9.8 9.6 0.7 5.9 0.4 |
32.0 16.6 191.5 97.6 95.0 - - - |
| Total | 240.6 | 100.0 | 432.7 |
IV. Comparison with airborne methane measurements.
The atmospheric team of the Japan Russia join research project measured vertical profiles of methane concentration above Plotnikovo test site on 3, 5 and 6 August 1994 using an observation aircraft (Tohjima et al., 1995). Figure 4 shows the flight path of the aircraft on 5 August. The rectangle is the SPOT image area. From the vertical profiles of methane concentration, we can calculate the amount of methane accumulated in a vertical column of air. We can also determine the accumulation period of methane, because the accumulation of methane starts in night time at around 9 o' clock when a temperature inversion layer begins to develop. Hence we can estimate regional methane fluxes by dividing the amount of accumulated methane by the accumulation period. Table 3 shows accumulated methane, accumulation period and estimated regional methane fluxes for three measurement days. The values of the regional methane flux varies from 40 to 146 mg CH4 m-2 day-1. This large variation would be ascribed to spatial and temporal variability of methane concentration. The average methane flux for three days observations was 96 CH4 m-2 day-1, which almost agrees with the methane flux estimate of 102 mg CH4 m-2 day-1 obtained from the combination of satellite and ground data.
| Date | Accumulated methane(mg m-2) | Accumulation Period (hour) | Methane flux(mg CH4 m-2 day-1) |
| 3. Aug. 19945 Aug. 19946 Aug. 1994 | 55 20 79 |
13 12 13 |
102 40 146 |
| Average | - | - | - |
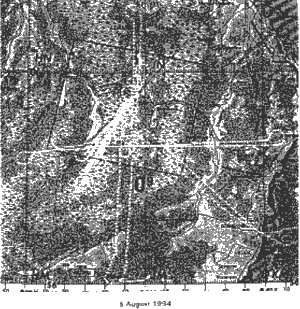
Figure 4: Flight path of the observation aircraft on 5 August 23, 2001 1994. The rectangle shows the SPOT image area.
V. Summary
A SPOT/HRV image was used to classify wetland ecosystems at Plotnikovo test site. Methane emission from the image areas was estimated by combining the result of ecosystem classification with ground methane flux data. This methane emission estimate was in good agreement with the average estimate obtained from airborne methane measurements. This demonstrates that ecosystem classification by remote sensing techniques would be useful in extrapolating ground methane flux measurements to regional or global scale estimates of methane emissions.
References
- Panikov, N.S., CH4 and CO2 emission from northern wetlands of Russia: Source strength and controlling mechanisms, Proceedings of the International Symposium on Global Cycles of Atmospheric Greenhouse Gases, 100-112, 1994.
- Tohjima, Y., Maksyutov, S., Machida, T., and Inoue, G., Airborne measurement of atmospheric CH4 over the west Siberian lowland during the 1994 Siberian terrestrial ecosystem-atmosphere-cryosphere Experiment (STEACE), Proceedings of the third symposium on the joint Siberian permafrost studies between Japan and Russia, 50-57, 1995.