| GISdevelopment.net ---> AARS ---> ACRS 1995 ---> Poster Session 4 |
Classification Methodology
for Land Cover Mapping Using Global Monthly 8-Km AVHRR Data
Wen Cheng-Gang and Ryutaro
Tateishi
Center for Environmental Remote Sensing (CERES)
Chiba University, 1-33 Yayai-cho, Inage-ku Chiba 263 Japan
Fax :+81-43-290-3857
Email: wen@rsirc.cr.Chiba-u.ac.jp
Abstract
Center for Environmental Remote Sensing (CERES)
Chiba University, 1-33 Yayai-cho, Inage-ku Chiba 263 Japan
Fax :+81-43-290-3857
Email: wen@rsirc.cr.Chiba-u.ac.jp
For the purpose of land cover classification of the global area, phenological information and temperature information were used by NDVI and Channel 4 of NOAA/NASA Pathfinder AVHRR Land Cover DATA Set. Phenological information includes onset of greenness, duration of greenness, green peak, total NDVI and a result of cluster analysis of 12 monthly NDVI. These feature images were used in order to identify ground truth data from existing maps.
Introduction
Phenological differences among vegetation types, reflected in temporal variation in the Normalized Difference Vegetation Index (NDVI) derived from satellite data have been used to classify land cover of asia. The objective of this research is to examine and illustrate the value of NOAA AVHRR data for the investigation of vegetation phenology. Specially, we are concerned with the depiction of the land cover of very large areas over time. Phenology is generally accepted as including not only the timing of recurring biological events but also their causes, especially with regard to meteorological phenomena.
Data Sources
10-days composites of NOAA/NASA Pathfinder Land Data Set with8km resolution were used in this study, and is georegistered to GOOD map projection. The size of the data are 5004 rows by 2168 columns.
Composite method
In one month, three 10-days composite data sets are included. The data sets consist of NDVI, CLAVR flag, QC flag, Scan Angle, Solar Zenith, Relative Azimuth, Ch1 Reflectance, Ch2 reflectance, Ch3 Btemp, Ch4 Btemp, Ch5 Btemp and Day of year. In order to remove noise and cloud, the monthly composite data were produced by the maximum composite method as follow:
- If a 10-days composite NDVI value of a pixel in one month is larger than 0.656, this value is eliminated as a noise.
- If there are one or two or three 10-days composite NDVI value of a pixel in one month corresponding with no-cloud status are below than 0.656, the average of these NDVI values is assigned to a monthly NDVI value. The average of coincident 10-days composite channel 4 values is also calculated as a monthly channel 4 value.
- If there is no 10-days composite data corresponding with no-cloud status but there are one or two or three 10-days composite data with mixed cloud status a pixel in one month, the maximum NDVI value below than 0.656 is chosen as a monthly NDVI value. The coincident 10-days composite channel 4 value is also chosen as a monthly channel 4 value.
- If there is no 10-days composite data corresponding with no-cloud or mixed status of a pixel in one month, the maximum NDVI value below than 0.656 is chosen as the monthly NDVI value. but if all 10-days composite NDVI value are larger than 0.656, the minimum NDVI value is chosen. The coincident 10-days composite channel 4 is also chosen as a monthly channel 4 value.
Where ch1 represents value from the visible channel (0.58-0.68mm) and ch2 represents value from near-infrared channel (0.725-1.1mm). The NDVI is then scaled to Binary NDVI by following equation :
the range of Binary NDVI value is from 3 to 253.
Image Classification
Land cover classification is carried out by analyzing monthly NDVI composite spanning the January to December 1990 period. through visual interpretation, an NDVI threshold of 0.2 was selected to separate much vegetation and less/no vegetation lands. The threshold was determined by comparison of the strata to available maps and imagery from different countries and regions in Asia and Oceania.
An unsupervised clustering algorithm was used to define 78 phenological classes using 12 monthly NDVI data sets.
Land Cover Characterization
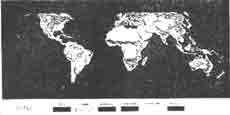
Using the 12 monthly NDVI data sets, the following phenological feature images were developed,
- Onset of Greenness- The month in which the NDVI value first rose above the threshold.
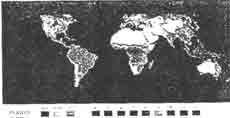
- Period of Greenness-The number of month when the NDVI reached or exceeded the threshold value.
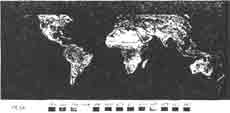
- Peak of Greenness- The month in which maximum NDVI occurred.
- Total NDVI- The means of monthly NDVI through 1990.
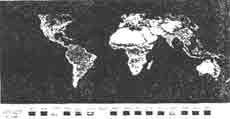
These images were derived through analysis of individual class NDVI statistics produced from the 12 monthly NDVI composites. Interpretation of temporal NDVI means led to the identification of the four interpretive images. The four factors are strongly related to the phenologic cycle of vegetation. The month in which the NDVI increases dramatically corresponds to the time of emergence of green vegetation at beginning of the growing season. The month of maximum NDVI reflects the time of maximum photosynthetic activity. The time that the NDVI exceeds a certain threshold value is similar to the length of growing season. The average of NDVI through one year generally reflects total photosynthetic activity or net primary productivity.
Summary and Conclusions
The previous examples of imagery about phenology in demonstrate that the AVHRR system provides us with a tool with which we can monitor the seasonal dynamics of world's vegetation at a very broad range of scales. Through the daily coverage of the AVHRR system combined with temporal compositing of NDVI we can obtain essentially cloud-free imagery for the entire land surface of the Earth on a regular and timely basis. The NDVI has been shown to be related to greenness activity and as such provides a useful means by which to monitor vegetation phenology.
Although this paper has only presented the role of 8Km coarse resolution data for vegetation monitoring, authors believe that AVHRR system should be used in conjunction with high-resolution sensors and systematic ground data collection to provide the means for better management of the Earth's resources.
In conclusion, we believe that the science and society community now has a new important source of data to provide quantitative information on the vegetation of our planet to answer questions which have been unanswerable due to the lack of spatially comprehensive and reliable data.
References
- Thomas R. Loveland, James W. Merchant, Donald O. Ohlen, Jesslyn F. Brown, 1991, Development of a Land-Cover Characteristics Database for the Conterminous U.S., Photogrammetric Engineering & Remote Sensing.
- Ryutaro Tateishi and Wen Cheng-Gang, 1994, Land Cover Database of Asia