| GISdevelopment.net ---> AARS ---> ACRS 1995 ---> Poster Session 4 |
Analysis of Multi-Temporal
SAR Images
Rasamee Suw
Anwerakamtorn
National Research Council of Thailand
Shoji Takeuchi
Remote Sensing Technology Center of Japan
Abstract National Research Council of Thailand
Shoji Takeuchi
Remote Sensing Technology Center of Japan
As a result of its cloud penetrating capability , the JERS-1 SAR data have provided a unique temporal Devel data set for observation of land use /land cover change in Thailand where the cloud coverage is a severe limitaton. Three different dates of SAR data acquired on March 16, April 29 and September 08, 1993 were used to monitor land cover change in the Central Plain of Thailand.
Unsupervised classification was applied for clustering of the SAR backscatter which has been pre- processed including filtering and calibration.
The result showed that multi-temporal JERS-1 SAR data include the information about seasonal Table change of land cover in the study area where paddy field is dominant. The difference in backscatter in paddy field is related to the stage of rice or the height of rice. However, there are other factors affecting SAR backscatter in paddy field ( i.e. water content / soil moisture and surface roughness) between March and April images. The clearer land cover type is riparian trees although they appear bright as the built-up area. Nevertheless there is a high potential to use the multi-temporal SAR data to detect the land cover change especially to monitor the different stages of rice.
1.Introduction
The synthetic aperture radar (SAR) data by Japanese Earth Resources Satellite 1, JERS-1, are expected to be used effectively for the purpose of monitoring of land use/land cover condition in the tropical regions the since the optical sensor data are difficult to obtain in timely manner due to cloud conditions while the SAR data can be obtained repetitively in any weather condition because of its cloud penetration capability .Therefore with the collaboration between the National Research Council of Thailand and Remote Sensing Technology Center of Japan under the support of the Special Coordination Fund of the Science and Technology Agency of Japan, the preliminary analysis of multi-temporal SAR data has been carried out for the Central plain of Thailand where the cloud coverage is a severe limitation.
2. Objectives
- To investigate the possibility of land cover classification using multi-temporal SAR images.
- To investigate the relationship between the seasonal changes of SAR backscatter and actual land cover types.
The study area is located between latitudes 14° 18' and 14° 38' and between longitudes 100° 02' and 100° 37' , covering some part of Ayutthaya, Ang -Thong and Suphan Buri; the Central Plain of Thailand . (Fig. 1). The main rivers in the area are the Chao Phraya and the Suphan Buri river. The terrain is mostly flat 11 and formed by deposition of sediment from the Chao Phraya river and other tributaries. The mean elevation of c the Flood plain is about 11 meters above mean sea level (MSL). The main land use is paddy field. ,
Fig. 1 The lacation of study area.
4. Methodology
4.1 Data Used
- Three different JERS-1 SAR data acquired on March 16, April 29 and
October 8, 1993 (Fig. 2) in the middle of dry season, the end of dry
season and the middle of rainy season, respectively, were used to
monitor land cover change of the study area.
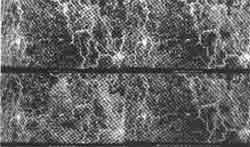
Fig. 2 Muti-temporal SAR images of the Central Plain of Thailand acquired on March 16, April 29, and September 08,1993.
- JERS-1 OPS data acquired on February 07,1993 and Landsat TM data acquired on the same day of SAR data (Apri129, 1993) were used as supporting and verifying.
- Ground observations were taken on March 18, April 29 and September 26,1995 (the same period of SAR data).
The procedures of digital SAR data analysis (shown in Fig. 3) are as follows:
Fig. 3 Procedures
4.2.1 Pre-processing
- The 12.5 m x 12.5 m resolution of SAR data were reduced to 25 m X 25m before filtering
- Map fiter was employed to remove the speckle noise.
- The filtered images were co-registered with each other as well as with digital geomorphological map in order to orient the geometry of the study area.
- SAR data calibration was conducted by the Normalized Radar Cross
Section (NRCS) which can be derived from the SAR level 2.1 product using
the calibration coefficient given by National Space Development Agency
of Japan as shown in Table I.
NRCS = 20 log10 (1) + CF [dB] (Takeuchi,1995)
where
I = Value of each pixel, which can be expressed from 0 to 215 - 1
CF = Calibration coefficient (-68.5 for all SAR data)
Table 1 Conversion Factor
CF (dB) Reception dat Processed data -68.5 Until end of April 92, Sept. 1/92,Since Sept. 18/92 Since Feb 15/93 -70.0 (same as above) Until Feb 14/93 -66.42 Between May 1/92 and Sept. 17/92 Except Sept. 1/92 Since Feb 15/93 Source: Shimada ,1993 .
- Calibrated images were converted from NRCS in dB to 8 bit to obtain
256 values of intensity by the equation as shown below.
Xc = 5 x (NRCS + 30 dB) (Takeuchi,1995)
where Xc = Digital count

- Principal component transformation was applied to reduce the spectral redundancy of 3 SAR images. The combination image of Ist component (R), 2nd component (a) and 3rd component (B) is shown in Fig.4.
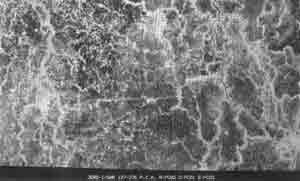
Fig.4 False color composite of Ist coponent (Red), 2nd component (Green) and 3rd component i (Blue) of 3 SAR images acquired on March, April and September.
4.2.2 Classification
Cluster analysis was employed to identify land cover type of the study area using 3 component images. Eight classes of land cover type were designed for clustering and classified by Maximum Likelihood classifier. The results of land cover classification are shown in Table 2 and Fig. 5.

Fig. 5 Land cover classification result by cluster analysis based on 3 principal components of 3 SAR images.
5. Results
The multi-temporal of 3 SAR images showed the interesting changing pattern in two kinds of paddy field. Fig. 6 illustrates the different backscatter of main land cover type in the study area. The change for paddy-1 is seen mainly in the central part of the images (Fig. 2). It was confirmed by ground survey that the area was almost covered by dry bare soil with no vegetation during March to April. This area is known as a ramified paddy field where rice is planted in the rainy season. These facts suggest a possibility that the increase of the SAR backscatter from March/ April to September is caused by the increase of vegetation cover. The change in paddy-2 is found mainly in the right side of the images. Almost of the area could be identified as bare soil wherever the brightness of color is different among the locations during March to April (evidenced by Landsat TM acquired on April 29,1993 ; the same day as SAR data and ground survey on April 29,1995). These suggest that the increasing of the backscatter from March to April was not caused by the change of vegetation coverage but by the change of soil moisture content condition and surface roughness (since the late of April is the season for land reclamation of the paddy fields) as well.
Fig.6 Typical seasonal change of the SAR backscatter (after Takeuchi and Suwanwerakamtom,1995).
Digital multi-temporal SAR data analysis which provided a lot of different backscatter using cluster analysis gives a good result of land cover types ( Table 2 and Fig. 5).
| No. | Categories | Land cover type
(Based on ground observation, JERS-1 OPS and Landsat TM data) | ||
| Middle of March | Late April | Early September | ||
| 1 | Rainfed paddy field (Paddy-1) | Bare soil | Bare soil | Paddy field |
| 2 | Riparian trees (Mixed orchards) | Riparian trees (Mixed orchards) | Riparian trees (Mixed orchards) | Riparian trees (Mixed orchards) |
| 3 | Second paddy field | Second paddy field | Bare soil | Paddy field (Early stage) |
| 4 | River/Prepared land | River/Bare soil | River/Bare soil | River/Prepared land (for rice cultivation) |
| 5 | Built-up/Urban area | Built-up/Urban area | Built-up/Urban area | Built-up/Urban area |
| 6 | Rainfed paddy field/ Second paddy field (Paddy-2) | Second paddy field/ Moist bare soil | Second paddy field / Moist bare soil | Paddy field |
| 7 | Prepared land | Bare soil | Bare soil | Prepared land |
| 8 | Second paddy field/Prepared land | Second paddy field | Bare soil | Prepared land |
6. Conclusion
The result showed that multi temporal JERS-1 SAR data include the information about seasonal change of land cover in the study area where paddy field is dominant. The difference in backscatter in paddy field is related to the stage of rice or the height of rice. However, there are other factor affecting SAR backscatter in paddy field ( i.e. water content / soil moisture and surface roughness) between March and April images. The clearer land cover type is riparian trees although they appear bright as the built-up area. Nevertheless there is a high potential to use the multi-temporal SAR data to detect the land cover change especially to monitor the different stages of rice. The cluster analysis using multi-temporal SAR images can be applied for discriminating the change of land cover types.
7. References
- Takeuchi S. and Suwanwerakamtorn R. , 1995, Analysis of the Influence of Land Cover Condition on SAR Backscatter Using Simultaneous SAR and TM Data, Journal of the Japan Society of Photogrammetry and Remote Sensing, Vol.34, No.5.
- Takeuchi S.,1995, A Method of Secondary Correction for SAR Standard Product (Japanese), Journal of the Japan Society of Photogrammetry and Remote Sensing, Vol.34, No.2, pp 54-64.
- Shimada M. , 1993, Image Quality of SAR/OPS, JERS-I Newsletter, No.1, October,1993.