| GISdevelopment.net ---> AARS ---> ACRS 1995 ---> Poster Session 3 |
Modeling for Global Land
Degradation using Remote Sensing and GIS
Krishna Pahari, Shunji
Murai
Space Technology Applications and Research program
School of Environment, Resources and Development,
Asian Institute Of Technology, GPO Box 2754,
Bangkok 10501, Thailand
Abstract Space Technology Applications and Research program
School of Environment, Resources and Development,
Asian Institute Of Technology, GPO Box 2754,
Bangkok 10501, Thailand
Land degradation or desertification has become one of most pressing environmental problems in the world today. This paper is an attempt to highlight the use of GIS and remote sensing for the assessment of global land degradation. The research is based on a combination of climatic modelling, mainly based on rainfall and temperature data and the physical process modelling, based on the analysis of land degradation mechanics, for which land use is an important contributing factor. Some preliminary findings of the research are also presented.
1. General Background
Land degradation is the reduction of land resource potential which can be manifested in various forms such as soil degradation (waer erosion, wind erosion or chemical degradation), degradation of vegetation of degradation of rangeland. Desertification may be considered as the land degradation in the arid, semiarid and dry subhumid areas due to natural of anthropogenic factors.
Although the land degradation is one of the most pressing environmental problems at the global level, the systematic study of global land degradation or desertification is emerging only recently. The technology of Remote Sensing together with global GIS is providing new possibility for a more scientific analysis of this problem.
2. The Research Methodology
In this research, the extent and nature of desertification is being studied by using two approaches, namely climate modeling based mainly on rainfall and temperature data, and the physical or bio-process modeling in which remote sensing data an important input.
2.1 Climatic model
This mainly consists of modeling for aridity and moisture indices calculated on the basis of temerature and rainfall data from many points around the globe and then interoplated to the areal data. The various indices considered are the following:
i. Moisture Index
This index is calculated by :
where, PET is the potential evapotranspiration, which can be estimated by using either thormthwaite method, Holdridge method or others. So for, the PET data produced by Ahn and Tateishi has been used for calculating this index.
ii. Martonne's Aridit Index
This is given by:
| AI = | P -------- T + 10 |
where, P = annual precipitation (mm),
T = sum of monthly mean temperature of those months with monthly mean temperature greater then 0, divided by 12.
on the basis of the values of this index, different areas can be classified into various zones.
iii. Aridity Index revised by Murai and Honda
The index used by Murai and Honda (1991) is slightly revised from the Martonne's index, with additional distinction between ordinary forest and tropical forest.
The range of values for different aridity classes in this method is given in Table 1. Figure 1 illustrates the steps involved in modeling aridity zones.
| Class | Martonne AI | Revised AI (Murai and Honda) |
| Desert | <=5 | <=5 |
| Semi-desert | 5-10 | 5-10 |
| Grass land | 10-30 | 10-20 |
| Forest | >30 | 20-40 |
| Tropical forest | -- | >40 |
| (annual ave temp>24°C) | ||
Figure 1. Flow chart of methodology for climatic modeling of aridity zones.
2.2 Physical and bio process model
Besides the climatic model, the physical processes of land degradation such as water and wind erosion can also be modelled by using the remote sensing data in combination to such processes, the remotely sensed data, particularly, NOAAGVI data, can be specially useful for such studies.
i. Water erosion
Water erosion is a function of land use/cover, rainfall, topography and soil characteristics. However, due to the scale factor, it is necessary to make some generalizations in case of global study. For example, to relate the topography for land degradation, instead of calculating the slope in absolute values, some topographic roughness factor may be more appropriate. Fig 2 illustrates the procedure for analysis of water erosion.
Figure 2 Flow chart of methodology for analysis of water erosion.
ii. Wind erosion
Wind erosion is function of speed and direction of wind, land use/cover and the soil properties. Some inference about wind conditions can also be made from the duration of dry period based on the rainfall data.
iii. Net primary productivity.
Since vegetation degradation is one form of desertification, the net primary productivity can also be taken as an indicator of the land degration. It has been shown by various authors (such as Box and Bai 1993) that NOAA GVI data have good correlationship with the primary productivity.
3. Preliminary Results and Discussion
So far, preliminary results from the climatic modeling have been produced. The results of Aridity zoning and the moisture index have been represented in Tables 1 and 2 respectively.. the results of the aridity zoning indicate the forest area of about 42% based on the climatic data. But the actual amount of forest is less than this, approximately 33% of the total area, as found by some authors (Murai and Honda 1991) by using remote sensing for mapping actual vegetation. This can be considered as an indication of deforestation from the natural forest cover for the given climatic conditions to other land use type.
| SR No | Aridity Zone | AI | Percent area |
| 1 | Desert | <=5 | 7.34 |
| 2 | Semi-desert | 5-10 | 5.94 |
| 3 | Grass land | 10-30 | 31.47 |
| 4 | Forest | >30 | 41.96 |
| 5 | Cold | - | 13.29 |
| SR No | Zone | MI | Percent area |
| 1 | Hyperarid | <0.05 | 2.45 |
| 2 | Arid | 0.05-0.20 | 8.39 |
| 3 | Semi-arid | 0.20-0.50 | 14.69 |
| 4 | Dry subhumid | 0.05-0.65 | 6.99 |
| 5 | Humid | >0.65 | 54.90 |
| 6 | Cold | - | 12.59 |
The moisture index (Table 2) values show the smaller area of hyperaird and arid zones and larger area of humid zones compared to the results of the desertification atlas(UNEP 1992). The reason may be related to the different method used for calculating the potential evapo6ranshpiration. The PET used here is taken from the global PET dataset produced by Ahn and Tateishi at 0.5 resolution.
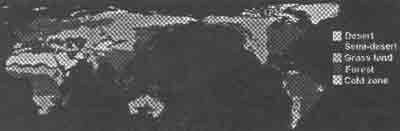
Figure 3 Aridity zoning based on Martonne's Arigty Index
4. Conclusions and Further Research
The research based on climatic model so far has demonstrated the usefulness of GIS for classifying the globe into different aridity and moisture index zones, which are important indicators of desertification. More work is underway to demonstrate the applicability of remote sensing and GIS for land degradation Studies at the Global level. Further research is being continued i9n the following way:
- Developing models for physical processes of land degradation such as water and wind erosion.
- Linking the climatic model with the physical process model.
- Linking local, regional and global level studies of land degradation.
- Box, E.O. and X. Bai (1993): "A Satellite Based World Map of Current Terrestrical Net Primary Productivity" in Seisan-Kenkyu (monthly journal of IIS, Univ. of Tokyo), Vol. 45, No. 9.
- Murai, S and Y. Honda (1991): "World Vegetation Map from NOAA GVI Data" in S. Murai (Ed), Applications of Remote Sensing in Asia and Oceania, AARS.
- United Nations Environment Program (1992) : World Atlas of Desertification