| GISdevelopment.net ---> AARS ---> ACRS 1995 ---> Poster Session 3 |
Field Prediction and
Potential Monitoring of Cassava Production in Nakhon Ratchasima
Y. Yamano and K.
Saito
Asia Air Survey, Co., Ltd.
13-16, Tamura-cho, Atsugi-shi,
Kanagawa-ken, 243, Japan
Tel: +081-462-22-1002
Fax : +081-462-22-1281
E-mail : KFHO214@niftyserve.or.jp
Abstract Asia Air Survey, Co., Ltd.
13-16, Tamura-cho, Atsugi-shi,
Kanagawa-ken, 243, Japan
Tel: +081-462-22-1002
Fax : +081-462-22-1281
E-mail : KFHO214@niftyserve.or.jp
As a new method for the preservation technique of weathered stone relics, the effectiveness of thermal infrared images have been confirmed.
Because the weathering area is distinguished from the other normal area by the difference of the surface temperature change pattern, it is possible to extract the parts deteriorated due to weathering by using thermal images. This method also have characteristics that are indirect, non-destructive and two-dimensional measurements, which are very important for valuable cultural assets.
In this paper, authors introduce two examples which was carried out under the different observation condition. One is the observation for stone relics carved in a cliff. This thermal environment is directly affected by sunbeams. The other is the case of the indoor observation. The target stone exists in the house where the range of the temperature change is smaller than outside.
The subtraction operation between two images that were acquired at different time in a day has been examined in the both case. It has been shown that thermo-anomalous parts were emphasized by these subtracted images and the distribution of weathered parts were consequently enabled to map.
1. Introduction
A new technique using thermal infrared video images has been examined for the test of soil mechanics of weathered stone relics. Characteristics of this technique are to measure by non-touch and non-destructively for the target. Many stone relics are generally made of tuff in Japan. They have been weathered for a long time. For the preservation of weathered relics, the measurement using thermal images has been adopted as a satisfactory technique.
The estimation of weathering condition by the direct looking to the object and by the hitting test of the schmidt hammer has been done until now. These means need to approach and to touch the target. It is a very clear that they are not available to apply to the very high and unclimbable place. As the direct looking depends on personal technique, it includes much subjectivity. Although the hitting test brings the information of the stone strength to us, this method is not able to display the two-dimensional distribution of the weathering area.
On the other hand, the thermal video camera can take the far and dangerous place, because it is able to zoom in. Moreover, thermal images are able to map the two-dimensional distribution for weathering phenomena.
2. Methods
2-1 The surface temperture change in a weathering area.
The surface temperature change is affected by the surface or inner condition of the object. The area that is covered by splitting show larger thermal change than the normal area. The surface temperature rises with the atmospheric temperature increasing. In the normal area, the heat can be transmitted efficiently into the object. the flaking area makes difficult to transmit the heat toward inside. On the other hand, the area including the standing water in cracks shows usually lower temperature than the normal area in the dayp city, therefore the standing water interrupts the heat conduction into the object. These concepts are shown in Figure.1.
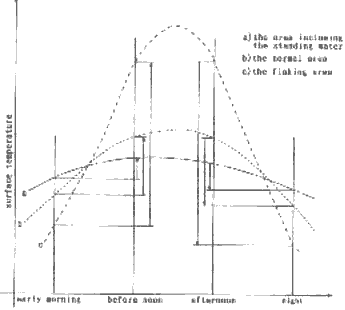
Figure 1 The suface temperature change in a day
2-2 Thermal infrared video
Thermal infrared video used in this study has the wave tenth range from 8,000 mm to 13,000 mm. This range decrease the influence of the reflection from the object and it is most efficient among the thermal range (Figure.2).
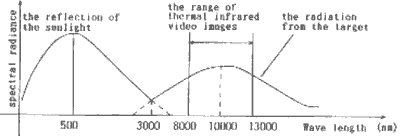
Figure 2 The wave length of the thermal video
Performance of the thermal video is indicated in Table. 1. It has three thermal range modes. The L-range that is able to measure from-40 c to 160 C was employed in this study. Also it has five scanning time modes. In this study, the 9.6 seconds scanning time mode was used. After the measurment, thermal data were saved into the SCSI hard disk or 3.5 inch floppy disks. One image size is 512 columns by 240 lines and one pixel has 12 bits.
| Items | Data | |
| Measurement range (°C) | L range | -40-160 |
| M range | 100-500 | |
| H range | 400-2000 | |
| Resolving Power(°c) | 0.05(at 30 °c of black body) | |
| Angle of visibility(°) | 30(H) x 28(V) | |
| Wave length (nm) | L range | 8000-13000 |
| M range | 8000-13000 | |
| H range | 8000-13000 | |
| Sensor | Hgcdte Stirling cooler Type | |
| Scanning time (s) | 0.08, 0.15, 0.30, 0.60, 2.40, 9.60 | |
| Display pixel numbers | 512(H) x 480(v) | |
| Capacity of memory | 512 x 480 x 16 bits x 4 memory | |
| Data recording mode | MS-DOS | 512 x 240 x12 bits 5 images per a disk |
| N88 basic |
256 x 230 x 8 bits 15 images per a disk | |
2-3 Content of the method
The flow of this method is indicated in Figure. 3. The content of each flow elements is described as follows.
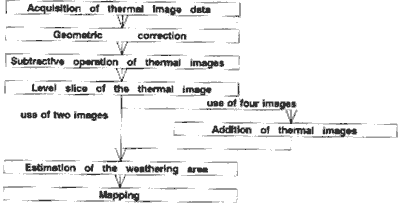
Figure.3 The flow chart of this method
(1) Acquisition of thermal image data
Thermal images were taken two or four times in a day. In the case of two times, thermal images were taken on the early morning and the afternoon. The early morning temperature is the lowest in a day, and it becomes higher in the just before noon or afternoon. If thermo-anomalous areas are included in the target, the characteristic change of the surface temperature will appear between two images.
Four images were taken in the early morning, the before noon. the afternoon and the night. The surface temperature rises from the early morning to the noon and falls from the noon to the night. The difference of two morning thermal images taken in the early morning and in the before noon indicates the thermal condition of the target at the time of temperature rising. The thermal condition at the time of temperature falling are shown by the difference of evening images that are acquired in the afternoon and night.
(2) Geometric correction
The geometric correction was carried out to correct each image.
(3) Subtractive operation of thermal images
In order to get the difference of the surface temperature, one thermal image is subtracted from the image taken at another time. In the case of using two images, the image of higher surface temperature (just before noon or afternoon image) is subtracted by lower (early morning image). The case of using four images get two subtractive images. One is the morning image that the before noon data is subtracted by the early morning data. The other is the evening image that the afternoon data is subtracted by the night data.
(4) Level slice of thermal image
Subtracted images are sliced by the degree of the temperature change and they are classified. In this study, the interval of temperature slice is about 0.25 C at the time of temperature rising and about 0.10 C at the time of temperature falling.
(5) Addition of thermal images
When four images are used, two images operated the level slice, that is, the morning and evening image are added to emphasize the surface temperature change.
(6) Estimation of the weathering area
The thermal condition of the anomalous area is different from the normal area. The reason is shown as follows.
The case of larger temperature change :
- The surface of the target is covered by different materials like splitting.
- There are cavities in the target.
- The cavity of the target includes the standing water.
- The water is welling up from cracks.
Thermo-anomalous parts are extracted and the weathering distribution are mapped.
3. Analysis and Results
3.1 Relieves of Kiyomizu cliff-surface stone Buddha in Kagoshima-ken
The target cliff area extends for 20 meters high and 400 meters long. About two hundreds of relieves were carved on the cliff surface from the thirteen century. Relieves that are called "three Sanskrit words" and "the five-storised pagoda" are selected in this study. They are carved outdoors and directly affected by sunbeams. The surface temperature change gives the difference of about twenty degrees twenty degrees centigrade in winter. Table.2 shows environmental parameters at the tome of data acquisition.
| Three Sanskrit words | The five-storied pagoda | |||
| Date | 1994.02.02 | |||
| Thermal video | JTG-4230 | |||
| Distance (M) | 80 | 10 | ||
| Time | 7:15 | 11:39 | 8:55 | 14:30 |
| Air temperature(°c) | 8.5 | 11.3 | 9.0 | 11.1 |
| Humidity (%) | 68 | 62 | 58 | 55 |
(1)The case of "three Sanskrit words"
Thermal images of "three Sanskrit words" were taken from the opposite side of the river far from about 80 meters. This cliff has an irregular surface. The relief was carved at about 13 meters high.
The subtracted thermal image is shown in Photo.1 and the weathering distribution map is shown in Figure.4 as the reference. This map was made by the photo interpretation and the size survey. Large temperature change areas on the upper cliff face to the southwest, because the surface that the flaking and covering splitting areas indicates larger change than another areas in the upper area of the cliff. The lower side of the cliff is hidden by trees except the center of the lower area. In this center area, the large change area is flaking and is covered by splitting.
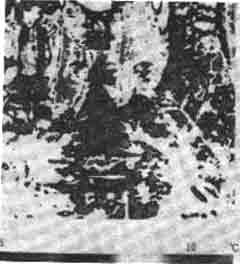
Photo 1 The subtracted image of "three Sanskrit words"
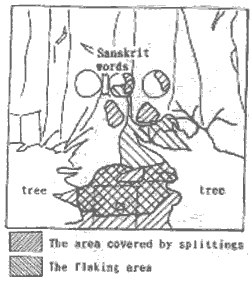
Figure 4 The weathering distribution map of "three Sankrit words"
(2)The case of "the five-storied pagoda"
"The five-storied pagoda" is carved on the stone of 10 meters high. This relief faces to the east. The surface of the relief makes the shade after the noon. The subtracted thermal image and the distribution map are shown in Photo.2 and Figure.5 each other. The surface temperature change was smaller than the case of "three Sanskrit words". As small river flows near the relief, the stone carved the relief is apt to be percolated by the ground water. However the lower area of the relief indicates large temperature change than the upper. This lower side corresponds to the area that is covered by splitting and flaking area.
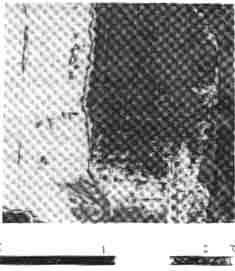
Photo 2 The subtracted image of "the five-storied pagoda"
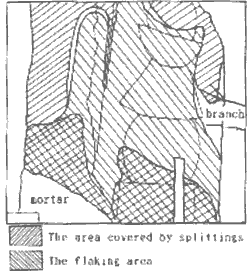
Figure 5 The weathering distribution map of "the five-storied pagoda"
3.2 The relief of "Moto-machi stone Buddha" in Oita-ken
The relief of "Moto-machi stone Buddha" was carved in the eleven century. The relief is inside of the shrine and is not affected by sunbeams. As the inner air temperature change are not large, the surface temerature change of relieves are smaller than the case of "three Sanskrit words" in Kiyomizu. Table.3 shows environmental parameters at the observation time.
| The relief of Buddha | ||||
| Data | 1995.02.16 | |||
| Thermal video | JTG-5700 | |||
| Distance (m) | 3 | |||
| Time | 6:24 | 10:13 | 14:37 | 19:20 |
| Air temperature (°c) | 2.1 | 9.5 | 10.7 | 8.1 |
| Humidity (%) | 73 | 50 | 45 | 60 |
The relief is weathered by the flaking and the deposition of the chloride. The water condition in the relief related to the deposition. The chloride deposits with the evaporation activity from the surface of the relief.
As four images were used in this case, the method of the addition operation was carried out for the analysis of the relief. The added image and the distribution map of the weathering are shown in Photo.3 and Figure.6each other. The left earlobe, the jaw and and right bosom show the large surface temperature change. There are the weathered or repaired area. The area from the jaw to the lower lip will be in danger of flaking off in the near future. The nose and the cuff of the right hand show the large difference of the temperature change, because projections and edges of the object rise the surface temperature in a daytime. Although these areas do not indicate the weathering, they may be weathered in future.
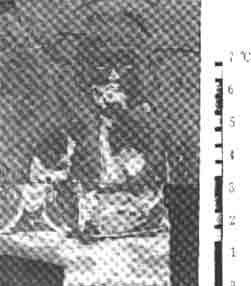
Photo 3 The added image of "Moto-amchi stone Buddha"
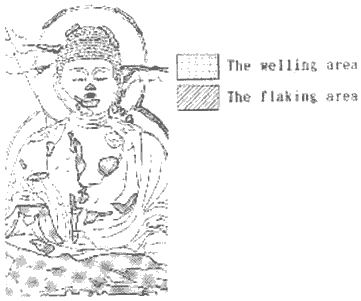
Figure 6 the weathering distribution map of "Moto-machi stone Buddha"
4. Conclusion
It was conformed that the method by using thermal infrared video images was effective for the prosirvation of the weathered stone relics. Advantages of this method are as follows.
- The target is not destructed by this method.
- It can display an untouchable place like a high cliff.
- The weathering condition is able to be objectively estimated.
- It is possible to map the two-dimensional distribution of the weathering.
- Thermal images are affected by meteorological environments.
- Edges or projection of the object tend to change the surface temperature largely.
Acknowledgments
The authors are grateful to Prof. Nishida for the useful advice. Sigeeyuki Tohyama and Ryuichiro Egawa always gave helpful comments during this analysis.
References
- Saito, K and Y.Yamano(1995), The Use of Thermal Images for the Preservation of Relieves of Buddha on a cliff, Journal of the Japan Society of Photogrammetry and Remote Sensing, vol.34 no.1, pp.2-3.
- Inoue, M., J Kanmura, K. Saito, Y. Yamano, S. Tohyama and K. Nishida (1995), An Examination on Weathering Condition Analysis of Cliff-surface Stone Buddha Images by Using Thermal Infared Sensor, Reports of the Symposium of Preservation Techniques for historicsites ,international society for soil mechinics and Foundation Engineering, pp. 47-52.