| GISdevelopment.net ---> AARS ---> ACRS 1995 ---> Poster Session 3 |
Comparison of Different
Sensors and Analysis Techniques for Tropical Mangrove Forest Mapping
J. Aschbacher, P. Tiangco,
C.P. Giri, R.S. Ofren, D. R. Paudyal, Y. K. Ang
European Commission, Joint Research Center,
IRSA, TP441, I-21020 Ispra (VA),Italy;
Tel: +39-332-785968, Fax: +39-332-785461,
E-mail: josef.aschbacher@jrc.it
Asian Institute of Technology (AIT), SERD-RSL,
GPO Box 2754, Bangkok 10501, Thailand
UNEP/EAP-AP. c/o AIT, GPO Box 2754, Bangkok 10501, Thailand
Abstract European Commission, Joint Research Center,
IRSA, TP441, I-21020 Ispra (VA),Italy;
Tel: +39-332-785968, Fax: +39-332-785461,
E-mail: josef.aschbacher@jrc.it
Asian Institute of Technology (AIT), SERD-RSL,
GPO Box 2754, Bangkok 10501, Thailand
UNEP/EAP-AP. c/o AIT, GPO Box 2754, Bangkok 10501, Thailand
The objective of this study is to compare different remote sensing sensors and analysis techniques for the purpose of mangrove mapping. A study area is Southern Thailand of approximately 40x30 km size was selected. A systematic assessment of strengths and limitations of data taken from different sensors, namely Landsat TM, Spot HRV, MOS MESSR, JERS-1 SAR, was carried out. The results of the investigation show that optical remote sensing data is highly suitable for mapping mangrove forests and can discriminate reasonably well four mangrove forest classes, namely homogeneous rhizophora, homogeneous nypa, mixed dense and mixed open mangrove forest. The classification accuracy is approximately 87%. The use of radar data alone resulted in a significantly lower classification accuracy, but on the other hand provided additional information related to the age distribution of rhizophora stands.
Introduction
A mangrove forest is a salt tolerant forest ecosystem of the inter-tidal regions along the coastlines. It is predominantly a tropical evergreen forest comprising trees and shrubs. Although the mangrove forest is characterised by very low floristic diversity it is considered as one of the most productive ecosystems. In the past year, mangrove forests into have been severely threatened by over-exploitation and, more recently, conversion of mangrove forests into shrimp ponds. Other factors of mangrove degradation are related to mining activities, establishment of industrial estates, coastal development and agricultural land expansion programmes. The environmental impact is irreversible and mostly severe with changes occurring with in a few months. The need for updated and continuous information is evident for a sound management approach.
Currently, monitoring is widely based on visual interpretation of aerial photography or optical satellite imagery. The latter is hampered by frequent cloud coverage along the tropical coastlines. This study will introduce radar imagery and digitally based analysis methods.
The work presented in this paper was carried out within the frame work of a research project sponsored by the Austrian Academy of Sciencess (AAS), With support from the European Space Agency (ESA), the National Research Council of Thailand (NRCT), the Thai Royal Forest Department (RFD), the Asian Institute of Technology (AIT), and the United Nations Environment Program (UNEP). The Austrian Association for Development & Co-operation (ADC) supported the administration of the project.
Objectives
The main objective of this study is to systematically compare different remote sensing sensor types for the purpose of mangrove monitoring. Data of common optical and radar sensors shall be compared , and a suitable methodology developed. Recommendations shall be made regarding the best approach for the use of remote sensing for mangrove mapping and monitoring.
Study Area and Data Basis
Study Area
A study area of approximately 30x40 km size was selected in Phanagnga Bay, Southwest Thailand. The center co-ordinates are 98.5 deg E, 8.4 deg N. The topography is generally flat, with a few single mountain cliffs reaching out from the Andaman Sea, or the land surface. The flat topography causes a very large tidal range with extended mud flats. The soil in the mangrove area comprises clayey and silty sediments., they are alkaline in nature and generally moderately fertile and high in organic matter. The climate is humid tropical with seasonal monsoon rainfall from April to September and around December [1,2]
The mangrove types observed in the study area are homogeneous stands of Nypa palms and Rhizophora, as well as mixed mangrove forest of varying density. Selective logging by the local people and tin mining activities are the main reason for deforestation, which is done in a reasonably controlled fashion. No conversion from mangrove forests into fishponds is observed in the study area.
Data Basis
The satellite images available for this study are listed in Table 1.
| Sensor | Acquisition date | Spatial resolution |
| Spot HRV | 22-Mar-92 | 20m |
| Landsat TM | 20-Apr-93 | 30m |
| MOS-1 MESSR | 22-Feb-89 | 50m |
| Jers-1 SAR | 8-Sep-92 | 18m (3looks) |
| ERS-1 SAR | 16-Jul-92, 20-Aug-92, 29-Oct-92 | 25x30m (3looks) |
Among the three optical images only the spot data are practically cloud-free, while the Landsat and MOS images show scattered clouds over the mangrove study area. No recent image with less cloud cover could be obtained of this region. The ERS-1 radar images were available in 8-bit only, as processed by the Indian receiving station. Data calibration was carried out according to [3]. The JERS-1 SAR data were available in standard 16-bit format. The Spot and multi-temporal ERS-1 images are shown in Fig. 1a and 1b, respectively.
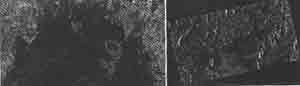
Figure 1: Mangrove study area of Phangnga Bay (Thailand), as shown in (a-left) Spot HRV imagery and (b-right) multi-temporal ERS-1 SAR imagery (image copyrights Spotlimage, ESA).
The interpretation of remote sensing data was supported by extensive ground measurements taken concurrently with ERS-1 overflights as well as topographic maps, soil maps, meteorological and tidal information and a digital elevation map.
Data Analysis
Systematic investigations were carried out to identify the sterngths and limitations of various sensors and sensor combinations as well as different analysis techniques. In particular, the analysis steps shown in Table 2 were performed [4].
| ID | Analysis Methodology | Data Source |
| 1 | Visual interoperation | individually: Landsat, spot, MOS, ERS-1,JERS-1 |
| 2 | Image rectification | all images rectified to UTMproi. |
| 3 | speckle filtering (Gamma MAP) | ERS-1,JERS-1 |
| 4 | Texture analysis (variance, homogeneous contrast, dissimilarity) | all ERS-1, images |
| 5 | Image stratification (GIS based) | Spot, Landsat, ERS-1, JERS-1 |
| 6 | Spectral/temporal signature analysis | Spot, Landsat, Spot & ERS-1, Landsat & ERS-1, ERS-1 & JERS-1, mERS-1 |
| 7a | Digital image classification | SPOT |
| 7b | Landsat | |
| 7c | ERS-1 & Spot | |
| 7d | ERS-1 & JERS-1 | |
| 7e | multi-temporal ERS-1 | |
| 8 | Integration of GIS for classification enhancement | as7 |
| 9 | Classification accuracy assesment | as 7 |
The center piece of the study is the systematic compariso9n of the five different digital classification methods shown as ID 7a-c in Table 2. Digital classifications were carried out based on both, single data sources such as Spot, Landsat or ERS-1, as well as combinations of different sensors such as Spot &ERS-1. Training sample selection for the maximum likelihood classification was based on detailed ground surveys carried out at different times of the year.
Results
The overall classification accuracies based on data from the various sensors showed that the highest accuracy is achieved combining ERS-1 and Spot imagery. The overall accuracy was 87.3% considering the following six classes: homogeneous rhizophora, ho9mogeneous nypa, mixed open mangrove forest, mixed dense mangrove forest, water, and rubber plantations. The classification accuracy based on r5adar data alone was significantly lower and reached 52.1% for combined ERS-1 & JERS-1 image data, which was also similar as for ERS-1 data alone. For comparison, the classification based on the Landsat image showed a relatively low accuracy of68.6%, which can partly be att5aibted to some misclassifications due to cloud cover. The Spot image, for comparison, was practically cloud-free and resulted in a classification accuracy of84.8% [1,4].
Taking the example of the combined ERS-1 & Spot classification, the error matrix for the classification of mangrove types is shown in Table 3. If the four mangrove types are considered as one class (mangroves) and a discrimination with the other non-mangrove classes such as rubber, water, dense forest, built-up areas and other land-cover is performed, the user's classification accuracy is 92.1 and 89.7%, respectively, for mangroves versus non-mangrove classes. The classified image is shown in Figure 2.
| Class | Omission(%) | Commission (%) | Map accuracy(%) |
| Rhizophora | 11.1 | 15.6 | 76.9 |
| Nypa palms | 9.7 | 12.9 | 80.0 |
| Mixed dense | 22.4 | 10.0 | 71.4 |
| Mixed open | 26.7 | 33.3 | 55.0 |
| Rubber | 8.9 | 13.3 | 80.4 |
| Water | 0.0 | 0.0 | 100.0 |
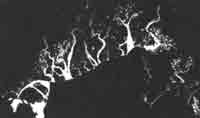
Figure 2: Classified land-cover map based on images of spot and ERS-1 (from[1]). Legend: Rhizophora (green), nypa (Yellow), mixed open mangroves (orange), mix dense mangroves (brown), rubber (red), water (blue).
An independent test of the different classification procedures shown in Table 2 (ID7a-e) was carried out on a different study area, located 50 km south of the area shown in Fig. 1. The results were very similar to the ones reported above, with overall accuracies of 83.8%, 48.0% and 72.9% for the spot & ERS-1, ERS-1 & JERS-1 and Landsat based classifications, respectively [1,5].
Conclusions and Recommendations
Based on the study of different sensors and analysis techniques of mangrove forests at a study area in Thailand, the following conclusions can be drawn:
- The use of cloud-free optical data is most suitable for the discrimination of mangrove form non mangrove areas.
- The best discrimination, also between different mangrove types, was achieved when both data sources, optical (Spot) and radar (ERS) data, were combined.
- At least four mangrove classes can be identified using optical data , namely homogeneous rhizophora, homogeneous nypa , mixed dense and mixe3d open mangrove open.
- The inclusion of radar data gives additional information on the approximate age of rhizophora stands, the presence of clear-cut areas or abandoned paddy fields. Multi-storied , uneven-aged mixed forest has a higher radar backscattering compared to more homogeneous stands. Clear-cut areas where tree trunks, twigs, stumps and other debris are still left on the ground give a strong radar backscattering signal.
- For the use of radar data the use of multi-temporal imagery is crucial, as is the selection of acquisition dates . Changes are occurring mainly in the non-mangrove areas.
- The inclusion of GIS-based data such as topographic information , or soil information increases the mapping accuracy.
References
- J. Aschbacher, C. P. Giri, R. S. Ofren, P. N. Tiangco, J-P. Delsol, T. B. Suselo, S. Vibulsresth, and T. Charuppat, "Tropical Mangrove Vegetation Mapping U sing Advanced Remote Sensing And GIS Technology"; Final Report, Asian Institute of Technology, 1994,90 pp.
- S. Aksornkoae, "Ecology and Management of Mangroves", IUCN Publ., Bangkok, Thailand, 1993.
- D. R. Paudyal and J. Aschbacher "ERS-l SAR data calibration at the Indian National Remote Sensing Agency"; Asia-Pacific Remote Sensing Journal, Vol. 6, No.2, Jan. 1994, pp. 117-120.
- J. Aschbacher, R. Ofren, J-P. Delsol, T. B. Suselo, S. Vibulsresth and T. Charuppat,"An Integrated Comparative Approach to Mangrove Vegetation Mapping using Advanced Remote .Sensing and GIS Technologies: Preliminary Results"; J. Hydrobiologica, Vol. 295, nos. 1-3, Kluwer Academic Press, Jan. 1995, pp. 285-294.
- J. Aschbacher, C. P. Giri, R. S. Ofren, P. Tiangco, D. R. Paudyal: "Comparison of different sensors and analysis techniques for tropical mangrove forest mapping"; Proc. IGARSS '95, 10-14 July 1995, Firenze/Italy; pp. 2109-2111.
The authors wish to warmly thank the staff of the Remote Sensing Laboratory of the Asian Institute of Technology for their continued and tireless support of the current work. In particular , the support of Mrs..Zhang, Ms. Srisa-ang and Mr. Shankar is acknowledged. Thanks are also given to Mr. Apan and Mrs. Bevis who supported the initial phase of the project.