| GISdevelopment.net ---> AARS ---> ACRS 1995 ---> Poster Session 2 |
Identification and Mapping of
Irrigated Vegetation using NDVI-Climatological Modeling
Ramesh S. Hooda and Dennis
G. Dye
Global Engineering Laboratory,
Institute of Industrial Science,
The University of Tokyo,
Japan
Abstract Global Engineering Laboratory,
Institute of Industrial Science,
The University of Tokyo,
Japan
Distinguishing artificially managed vegetation (mainly agricultural crops and termed here as irrigated vegetation) from the natural vegetation is an important step in modeling and monitoring terrestrial primary production and carbon cycling through satellite remote sensing. Spectral indices such as the normalized difference vegetation index (NDVI) provide information about the vigor of the vegetation which in turn is influenced by climatic factors. Therefore, NDVI of the region is expected to have a relationship with the climatic parameters. NDVI values for irrigated vegetation ( mainly agricultural crops), however, would show a less strong relationship to climatic factors compared to the natural vegetation which is totally dependent on climatic conditions. This differential behavior of the of the r two types of vegetation can be exploited to identify and map the irrigated and non-irrigated vegetation zones. The irrigated vegetation pixels a re screened out as outliers in the NDVI-climatological relationship. The present paper reports on work in progress in which we are examining the possibility of identifying irrigated vegetation based upon above relationship. NOM A VHRR 10 day composite NDVI data with 8 km spatial resolution was used in combination with monthly average climatic data of the region for the study. The Indian territory having substantial mix of r irrigated and natural vegetation, was chosen as the case study area
1. Introduction
Biomass and productivity estimates from spectral data in the visible and near-infrared wavelengths originally used highly empirical relationships to assess the important biological variables of vegetation (Emori et al 1978 ) . Recent work on this subject is more analytical and assumes that r- productivity results from photosynthesis through which a fraction of the incident solar energy that is intercepted by vegetation canopy is converted r into biomass (Prince, 1991; Ruimy 1994). This involves decomposition of productivity into several independent variables such as incoming solar radiation, fraction of radiation absorbed and conversion efficiency of absorbed radiation into dry matter (E).
A major challenge in the NPP estimation is finding representative values of E for various vegetation types as it changes with the types of vegetation and climatic conditions (Stockle and Kiniry, 1990). Estimating productivity based on vegetation indices, therefore, requires a land cover classification that distinguishes natural and irrigated vegetation (mainly agricultural crops) to account for differences in E. In this paper we examine the potential of an NDVI -climatological modeling approach to distinguish natural and irrigated vegetation.
2. Background
The normalized difference vegetation index (NDVI) is calculated from surface reflectance in red (R) and near infra-red (NIR) regions obtained through sensors onboard many remote sensing satellites as
------------
NIR+R
NDVI is an effective indicator of the amount of green vegetation present in an observed landscape. Goward ~~ (1985) showed that vegetation indices such as NDVI are related to net primary production (NPP, gm-2 year-I). Kumar and Monteith (1981) showed that the fraction of photosynthetically active radiation (PAR) absorbed by the vegetation cover is related to the ratio of red reflectance (R) to near-infrared reflectance (NIR). Asrar ~ ~ (1984) subsequently related the NDVI to the fraction of PAR absorbed. These and related studies led to development of the "production efficiency model" (PEM). The simple form of the PEM is:
where L(APAR) is the annual sum of APAR and E is the PAR conversion efficiency (g MJ-I). To account for differences in E for different types of vegetation, first a classification among natural and managed vegetation is required.
Because climate influences the condition and growth of vegetation, the NDVI of a region may be expected to be related to the climatic variables of the region. The NDVI for artificially managed (irrigated) vegetation, however , should show a less strong relationship to the climatic factors compared to the natural vegetation which are entirely dependent on climatic conditions. This differential behavior of the of the two types of vegetation may be exploited to separate them. If NDVI is correlated with climatic variables that are known to influence plant growth, particularly temperature and rainfall, the pixels associated with irrigated vegetation can be separated as outliers. The values of these pixels then can be used in automated classification which distinguishes the irrigated vegetation from the natural vegetation.
3. Study Area
The study area consists of the Indian subcontinent and adjoining areas, which have a substantial mix of irrigated and natural vegetation. In India, .the role of agro-ecosystem should be significant, since 45 percent of the geographical area of the country is under agriculture compared to 10-11 percent globally (Dhadwa1 1994). Because the area has large deviations in climatic conditions and therefore, variety of vegetation, it provides a suitable study area in which to develop and evaluate our approach.
4. Methodology
Pathfinder A VHRR Land (PAL) 8 km data from NOAA 11 satellite was obtained from the Goddard Distributed Active Archive Center (DAAC), USA. .The data for the year 1989 was selected for the study as it was a relatively normal year with respect to Indian monsoon which greatly influences vegetation growth and dynamics in the region. The NDVI is calculated from atmospherically corrected surface reflectance from the visible (0.58 -0.68) and near infra-red (0.725 -1.100) AVHRR channels. The 10 day composite ; NDVI data has been prepared by selecting the maximum NDVI value from ..the daily data during the 10 day period. This removes the effect of clouds to give a cloud free data set. A monthly average NDVI data was prepared by calculating the: mean value for each pixel from the 10 day composite NDVI data set. As the area has different well defined growing seasons, as discussed later, seasonal average and total NDVI data sets were also prepared. These seasons include July to October (hot/humid monsoon season), November to March (dry winter season) and April to June (Summer season). Annual average and total NDVI of the area was also calculated.
The daily data on temperature and rainfall was obtained from Global Daily Summary for the years 1977-1991 produced by National climatic Data Center, USA. Mean monthly temperature and total monthly rainfall were calculated from the daily data from about 177 meteorological stations spread allover India. The average data values for the 15 years period we re then calculated. The point-location data were subsequently interpolated to prepare average mean monthly temperature and average total monthly rainfall maps of the region. These data are analyzed vis-a-vis NDVI in different growing seasons.
5. Results and Discussions
The natural vegetation in the Indian peninsula has tropical dry deciduous and moist deciduous forests mainly in central and southern parts which shed their leaves in the autumn season. Therefore, the NDV~ in these areas starts decreasing in November and again starts increasing in March. However, India also has some areas under tropical evergreen forests in the northern Himalayas, north-eastern states and along western sea coast which show higher NDVI most of the year .
The northern Indo-Gangatic plains are the largest agricultural region in the area which has substantial irrigated agriculture. Besides this there are other agricultural areas scattered allover India having both dry land and irrigated agriculture. There are distinctively two agricultural cropping seasons locally called as Kharif and Rabi season s. Kharif season begin sin July and lasts in October. It is a hot and humid season characterized by heavy monsoonal rainfalls. Therefore, the NDVI in the area starts increasing with the sowing of Kharif crops in July and reaches its peak in the month of October (Fig. I). Then it suddenly drops in November because of ripening and harvest of the agricultural crops. Rabi season extends from November to April which is dry and relatively cold particularly in the northern India. Therefore, NDVI again starts increasing in December indicating canopy development of the Rabi season crops. It reaches its peak in February / March (Fig. 2) and then suddenly drops in April because of yellowing and harvesting of the crops. The season from April to June is relatively hot and dry and the agricultural fields : remain almost vacant showing very low NDVI.
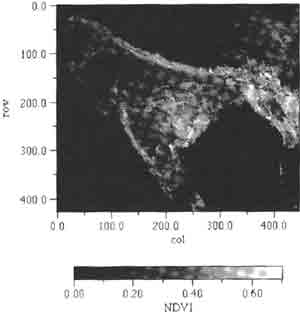
Fig. 1. Average NDVI image of India dl.U"ing October} 1989.
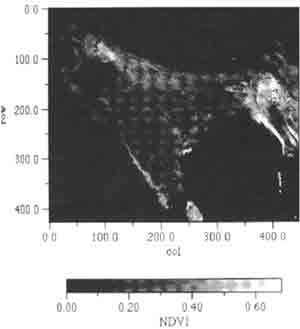
Fig. 2. Average NDVI of India dilling February 1989.
The average NDVI data for these three major seasons and annual average NDVI is being analyzed with the average monthly mean temperature and : average monthly total rainfall. In our current work we are continuing to develop, test and refine the NDVI- climatilogical method which shows a promise for automated identification and mapig and mapping of irrigated vegetation promise for automated identification and mapping of irrigated vegetation.
References
- Asrar, G., Fuchs, M., Kanemasu, ET. and Hatfield, J.L. 1984. &timating ~ absorbed photosynthetic radiation and leaf area index from spectral r reflectance in wheat. Agron. J.,76: 300-306.
- Dadhwal, V.K, Shah, A.K and Vora, A.B. 1994. Carbon flow through Indian r agroecosystem: A priliminary account. In Global O1ange Studies, Scientific ,Report, ISRO-OBP-SR-42-94. ;
- Emori, Y., Yasuda, Y., Yamamoto, H. and Isaka, I. data.base of spectral ~ignature in Japan. In: Proc. Int. Symp. on Remote SensIng for (J)servatIon and Inventory of Earth Resources and the Fndangered Fnvironment, Freiburg (FRO), 2- 8 July, 1978, 22(7/ 1 ):543 -566.
- Goward, S.N., Tucker, CJ. and Dye, DO. 1985. North American vegetation patterns observed with the NOAA-7 Advaned Very High Resolution Radiometer. Vegetatio, 64: 3 -14.
- Kumar, M. and Monteith, J.L. 1981. Remote sensing of crop growth. In: H. Smith (ed.), Plants and the daylight spectrum. Academic press, London, pp. 133-144.
- Price, S.D 1991. A model of regional primary production for use with course resolution satellite data. Int. J. Remote Sensing, 12: 13 13 -133 0.
- Ruimy, A., Saugeir, B. and ~dieu, a. 1994. Methodology for estimation of terrestrial net primary production from remotely sensed data. J. aeophy. R., 99: 5263-5283.
- Stockle, C.O. and Kiniry, J.R. 1990. Variability in crop radiation-use efficiency associated with vapor-pressure deficit. Field Crops Research, 25: 171-181.