| GISdevelopment.net ---> AARS ---> ACRS 1995 ---> Poster Session 2 |
Capability of Remote Sensing
Application in Landuse, Land Resources with using TM Data, GIS Facilities,
in Part of Iran
Majid Ghiassi, Mehrdad
Nematzadeh
Remote Sensing Specialist
Agricultural Static and Info.
Dept. (ASID) Ministry of Agriculture Tehran Iran.
Phone: 9821-6122104
Fax:9821:650377
Abstract
Remote Sensing Specialist
Agricultural Static and Info.
Dept. (ASID) Ministry of Agriculture Tehran Iran.
Phone: 9821-6122104
Fax:9821:650377
Capability of the landsat thematic mapper (TM) with high resolution, has now become much applicable to mapping, the various units of land resources, efficiently and accurately in a shorter period of time. During work described in this paper an at tempt has been made to prepare various Landuse map by visual and digital interpretation of the TM data in conjunction with field check, covering an area about 68450 square km, in northern part of IRAN. In this project for interpretation, of the 9 quadrant from TM data, including visual interpretation, geometric correction, image enhancement, and classification were applied to investigate, the total of 7 magor landuse levels, with their detailed sub-classes.
The GIS facilities also were applied to overlay and combine the results of visual and digital analysis.
The result of this project were the 1:100,000 scale landuse maps with the 30 by 30 geographic coordinates.
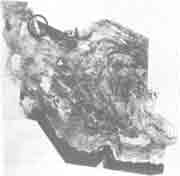
Location of Area in Photomap of Iran
1: Introduction
The thematic mapper (TM) data form landsat satellite have been utilized in Iran for the last few years to recognize and assess, land resources in various ways, proving their efficient performances as a good tool, especially for landuse mapping and land deduction in general.
However the advent of the thematic mapper (TM) data with high resolution has made the mapping work facilitate better interpretation and analysis of the required object, as such, in this paper an attempt has been made to extract various information of crop land and land resources of Gilan region.
2: Method and Meterials
To start with, the false color composit of the landsat TM, data inbands, 2,3,4 and 4,5,7 in the month of June July 1989, 1990 1991 and 1993 at the average of 1:100,000 scale, were selected, the total image are 9 quadrants which cover the gilan province, an area about 68450 square km were chosen, for visual analysis as reflected through the image characteristics, during the month of July when the data were scanned, most of the crops land were harvested, or in some part were not devoid of crops, consequently, the radiant energy which produced the spectral signature mostly form the harvested surface, with communicated a good and use full-idea to the interpreter that the various image characteristics recorded on the imagery were mainly due to the variation of crop land and soil color with the colors of exposed stones, and rocks, in forest region, and bare surface, the interpretative boundary become almost of crop land boundary in the region, all these interpretative units were correlated and compared with available data in hand, finely a landuse units were extract, after collection of ground truth, for compared interpretative units boundary with digital analysis units and available CCT tape, digitizing map also apply the GIS method, to overlay and combine together.
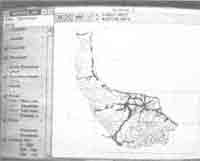
Location of Study Area in Index of TM:
3: Visual Interpretation
The interpretation of the TM data was car red out in the Remote sensing laboratory, ASID on the basis of various image characteristics to occur in the area
Meterial
This project was performed using map, satellite landsat (TM) data.
The MAP were:
Soil map classification of study area 1:250000 scale
Geology map of area 1:250000
Forest map of area 1:250000
Topography map of area 1:250000
Hydrology map of area 1:250000
| Sensor | Date | Pixel | Scale |
| Landsat-TM | June 1989 | 30x30 | 100000 |
| June 1990 | 30x30 | 100000 | |
| July 1991 | 30x30 | 100000 | |
| January 1993 | 30x30 | 100000 |
| Landsat-III | Designation | Wavelength |
| CCT. July 1993 | 1 | 0.45-0.52 um |
| 2 | 0.52-0.60 um | |
| 3 | 0.63-0.69 um | |
| 4 | 0.76-0.90 um | |
| 5 | 1.55-1.75 um | |
| 7 | 2.08-2.35 um | |
| spectral bands of the sensor | ||
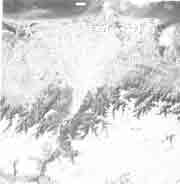
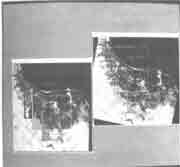
Image of Study Area - 1989
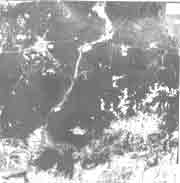
Image of Study Area - 1991
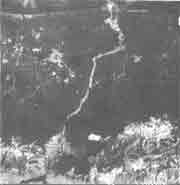
Image of Study Area-1989
3.1 Field Work
With these recognition units, a quick traverse was prepared, in the field to collect ground truth on landuse map, physiography, for preparation of the maps corresponding to the landuse map, other scientist have also collaborated various natural resources.
4.Digital Image Analysis
digital image processing is the numerical manipulation of digital image and includes preprocessing ,enhancement, and classification
4.1-Preprocessing:
In the initial processing of the raw data to collaborate the image radiometry correction,geometric distortions ,and remove noise.
4.2-Enhancement:
Image enhancement produces a new enhanced image, that is displaied on(CRT),this enhanced image may be easier to interpret than the original image in different ways, for example ,more efficient use may be made of the orginal information.
4.3-Geometric Correction
After processing raw data and apply projection properties of a map which is called geometric correction ,a related technique were called registration ,to utilizing of the coordinate system of one image to apply of same map or a second image of the same area ,for example landsat TM image of given area might be obtained for different dates and the user may wish to measure changes that have occurred in period of time ,the correction with two image of map, a map can be defined as graphic representation on a plane surface of the earth's surface.
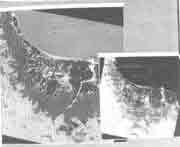
Geometric Correction of Study Area
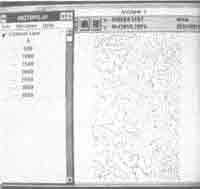
4.4 Image classification For supervised training a representative area for each sample class must be located in the image ,it is important that the training area be a homogeneous sample of the respective class ,but at the same time ,the range of variability for class must be included ,thus more than one training area ,per class is often study area. aerial photography and existing maps are used to verify the training sites ,if there is considerable within. class variability, the selection of training sites can be laborious ,and it is impossible to be entirely certain that a comprehensive set of training samples for each class has been specified, sometimes in many cases it is impossible to obtain homogeneous sites,the problem is sparse vegetation, which complicates attempts to map both vegetation and soil ,one technique for improving training data under these conditions is to clean the sites of outlying pixel ,before developing the find class signatures, the cleaning operation involves applying histogram of scatterploting operation on the training data. until to apear interest classes ,after the apear classes it is possible to designe pseudocolor image and transfers a pseudo color table segment stored on the database file, in this case to convert pseudo-color segment to transfer arc/view format was designed to be developed all purpose standard for image interchange tiff file. Consist ,of an image with a list of information tages describing tile image, and then used GIS methodology ,to converte the grid form at of ARC/info ,polygon type ,the digital classification landuse units are overlay the GIS system.
Digital Image Classification Of Whole Gllan Region
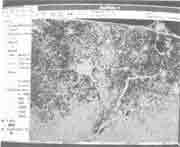
Transfer Image Classification to GIS
Drainage Pattern and Roads in GIS
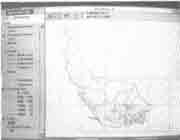
Image of Topography Pattern in Study Area
Topography Image of Test Area
5. Lanuse Map
It has already been stated that TM data were scanned in the june July 1989 1990 1991 and 1993, when the land surface in the region is most harvested or in some place was not harvested of crop, in this condition operation of map detailed information about landuse was recorded, while studding the forest unit and soil capability of the area, all these information along with the new data from the survey of Iranian topo sheel to convention of different scale, and available data relating to various correlated image characteristics, were used to prepare the map, according landsat imagery, the index of TM data, with topo maps index of 1:100000 scale, gilan province recorded approximately 11 map sheets was delineated.
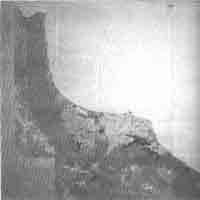
Image of Landuse Classification Map
| Irrigated Land | |
| without limitation or low Iimltatlon | 11 |
| with limitation | 12 |
| nonirrigated land | DF |
| orchard | 0 |
| tea | T |
| olive | OL |
| mix with and crop land and orchard | 10 |
| mic with orchard and crop land | 0I |
| Forest Land and Wood Land | |
| high density Qr medium density forest | F1 |
| low density forest | F2 |
| mixed forest 811d orchard | FO |
| Range Land | |
| high density or medium density | R1 |
| low density range | R2 |
| mixed range and nonirrigated land | RD |
| Barren Land | |
| salty land without vegetation coverage | SL1 |
| sallty land with native vegetation | SL2 |
| sandy dume | SD |
| bare land | B |
| Wet Land | |
| reed bed | RB |
| swamp | SW |
| Surface Water | |
| natural lake | L |
| dam lake | L1 |
| permanent river | y |
| seasonal river | -.-.-.-.-.-. |
| canal | =========== |
| Urban Built-up Land | |
| urban area | U |
| constraction | U1 |
| airport | 'T' |
| main road | __________ |
| secondary road | ---------------- |
| railway | +++++++++++++ |
| interrlational boundary | |
| province boundary | |
conclusion:
Due to the wide spectral range of TM data, the better manipulation ability would be provided for analyst in the different stages of image processing. In the other hand, the sufficient number of TM spectral bands which causes more collection of ground features would be concerned to define the better detailed landuse units and consequently, the more detailed information would be extracted from relative landuse maps.
It is obvious that using the other kinds of satellite data (SPOT,COSMUS,...) combined with TM data and integration of visual and digital interpretation could provide the more useful and correct landuse maps.