| GISdevelopment.net ---> AARS ---> ACRS 1995 ---> Poster Session 1 |
Relationship Between Land
Cover and Noaa GVI in Thailand
Eiji Kodani*1, Haruo Sa
Wada*2
* 1 Forestry and Forest Products Research Institute Shikoku Center
915 Asakuratei, Kochi- Kochi-ken, 780 Japan
E-mail : kodani@ffpri.affrc.go.jp
*2 Forestry and Forest Products Research Institute
1 Matunosato, Kukisaki-tyou, Inawasiro-gun, Ibaragi-ken, 305 Japan
Abstract * 1 Forestry and Forest Products Research Institute Shikoku Center
915 Asakuratei, Kochi- Kochi-ken, 780 Japan
E-mail : kodani@ffpri.affrc.go.jp
*2 Forestry and Forest Products Research Institute
1 Matunosato, Kukisaki-tyou, Inawasiro-gun, Ibaragi-ken, 305 Japan
In this study, effect of forest cover on NOAA Global vegetation Index(GVI) was discussed. Using climatic region map, Thailand was classified into 5 regions by humid months and elevation. In 5 climatic regions, correlation efficient and linear regression equation between forest area percentage and annual total GVI were calculated. Since gradient of all 5 equation are positive, annual total GVI incres .with increa in forest.area percentage each climatic regions. Since intercept of 4 regression equation increases with increasing count of humid months, humid months affect annual total GVI not only forest land but also other land cover.
I. Introduction
Lately, growing demand for timber and agricultural expansion cause deforestation. Therefore, forest information is needed to assess them and remote sensing is hoped to provide this information. When using high resolution satellite data, for example, LANDSA T and SPOT, it is more difficult to observe land cover on country or continental scale than on regional scale, since monitoring land cover on larger scale make it more difficult to solve problems, for example, removing cloud, geometric correction and r- radiometric correction. By contrast to this, GVI data which are produced with meteorological satellite NOAA, are spatially continuous cloud free imagery, were corrected geometrically, and are corrected radiometrically( 1,2,3 ). These days, GVI data are published with CD-ROM and it is easy to handle data. In this study, relationship between GVI and forest cover was discussed.
2. Preparing data
GVl data were derived from "Global Ecosystems database" published by EP NNOANNGDC. These GVl data are edited to monthly data. This CD-ROM include 69 month data from April 1985 to December 1990. F or analysis 12 month GVI in one year were totaled up to annual total GVI(sigma GVl). To minimize fluctuation sigma GVI affected by climate fluctuation, sigma GVI was averaged from 1986 to 1990. Administrative division map on 1/2.5 million scale and climatic regions map on 1/4 million scale(Fig. I) of Thailand which was published by Royal Thai Survey Department and forest cover map in 1985 on 1/4 million scale( Fig. 2)(4) were collected. Maps were digitized and converted to raster data. Forest c over map was digitized more finely than GVl mesh size and forest cover area percentage(Forest%) was calculated in each GVI mesh and projected on map. GVI and maps were managed with GRASS, GIS software on latitude longitude 1/6 degree mesh size. For analysis and plotting data, Visual STA T(Statistics) was used.
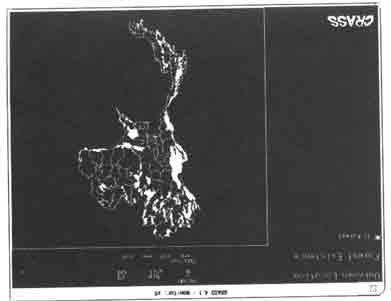
Fig 1 Forest cover map
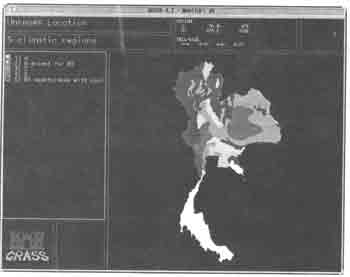
Fig 2 Climate region map
3.1 Relationship between sigma GVI and forest cover
First, I discussed that forest cover affect sigma GVl in whole Thailand. When using LANDSA T imagery, Vegetation Index(VI) in forest cover is bigger than in other land cover. To reveal this trend about sigma GVI, with Forest% category as X axis and GVI as Y axis, data were plotted by not scatter plot but box plot(Fig. 3), since too many data prevent me from seeing diagram easily. This diagram shows that GVl increase with increasing Forest%. Correlation coefficient and linear regression equation between Forest% and sigma GVI was calculated(Table 1).
| Category | Regression Equation | r | n |
| Whole Land | Y=0.017*X+3.17 | 0.562 | 1514 |
| A | Y=0.005*X+4.49 | 0.164 | 216 |
| B except B5 | Y=0.007*X+3.67 | 0.215 | 177 |
| C | Y=0.021*X+3.35 | 0.375 | 401 |
| D | Y=0.029*X+3.11 | 0.314 | 224 |
| B5 | Y=0.006*X+4.58 | 0.467 | 496 |
Fig 3 Relation between Forest% and sigma GVI
3.2 Relationship between sigma GVI and humid months
Second, I discussed that climate affect sigma GVI. In Thailand, rainfall affect vegetation activity and vegetation activity affect GVI. In other words, in dry season when rainfall is scanty, G VI is low, while in miny season when rainfall is ample, GVl is high. Therefore, length of rainy season, or count of humid .,months affect sigma GVI.
In climatic regions map Thailand is classified into 4 climatic regions (i.e. A, B, C and D) by count of humid months. Climatic region A, B, C and D have 8-10, 6.5-8, 5.5-6.5 and 4.5-5.5 humid months, respectively. Climatic region A is named equatoropical climate and located in southern area or peninsula area of Thailand. Climatic region B, C and D is named tropical monsoon climate. Climatic region D is located in center of Korat plateau, and located around Kanchanaburi city and Nakhon Sawan city. Climatic region Band C surround climatic region A. Thailand is classified into 12 climatic regions, in detail. Since B5( mountainous with cool dry season in valleys) in these 12 climatic regions is located in higher land, rainfall effect on sigma GVI in B5 is different from effect in other 11 climatic regions. So for sigma GVI analysis, climatic region B is classified into two climatic regions, B5 and B except for B5.
To analyze effect of 5 climate categories, A, B except for B5, C, D and B5 on sigma GVI, data was plotted(Fig. 4). Fig. 4 shows that sigma G VI increases with increasing count of humid months except for B5.
Fig 4 Relation between 5 climate regions and sigma GVI
3.3 Relationship between sigma GVI and forest cover in 5 climate regions
However, averaging Forest% in each climatic regions, A, B except for B5, C, D and B5 have 24%,8%, 4%, 1% and 42%, respectively. In 1985 forest is unevenly distributed. In other words, A and B5 climatic region have large forest cover, while B except for B5, C and D have small forest cover. Therefore, it is possible that since B except for B5, C and D have small forest cover, sigma GVI in these regions are low. Climatic region includes several types of land cover and affect GVI on whole land cover. Therefore, it is necessary to take account of humid months effect on sigma GVI, before analyzing Forest% effect on sigma G VI. In 5 climatic regions, or A, B except for B5, C, D and B5, correlation coefficient and linear regression equations between Forest% and sigma GVI were calculated(Table 1).
Table 1 shows that the more humid months, the more intercepts of 4 regression equations except B5. Intercept means sigma GVI in the case that there is no forest cover. In the other words, intercept is sigma GVI removing forest effect on GVI. Therefore, count of humid months affect sigma GVI. Table 1 shows that the higher Forest%, the higher sigma GVI since gradients in all regression equations are positive. Gradients of regression equation, or forest effect on GVI are different in 5 climatic regions, but form of regression equation in 5 regions are similar to form in whole Thailand.
3.4 Evaluation of regression eguations
Hypothesisis defined, as follows
HO:r=0, Hl:r#O (r: correlation coefficient of population, r: correlation coefficient of sample)
In the case that hypothesis Ho is tested against hypothesis HI at a=0.05, in all equations Ho is rejected Therefore, it is false that Forest% doesn't correlated with sigma GVI. However, correlation coefficients r are small in A and B except for B5,.
In section 3.3 study, effect of forest cover on sigma GVI was discussed. Conversely, it was tested to estimate Forest% using sigma GVI for evaluating regression equations. Using regression equation of whole Thailand, Forest% was estimated and projected on map. This map is similar to Forest% map, roughly. However, estimated Forest% in climatic region A and B5 were higher than Forest%. Similarly, estimated Forest% in 5 climatic regions was calculated and projected. This map is more similar to Forest% map than the former map. Estimated Forest% in B5 were improved. However, in climatic region A and B except for B5, data where high Forest% data are have high estimated Forest% while some data where low Forest% data are have high estimated Forest%.
4. Discussion
Here, some reasons correlation coefficient is small were discussed. Roughly, reasons were classified into two, GVI error which occur when GVI data are produced, and other land covers except forest effect on GVI. The latter was discussed. Since GVI mesh area(about 18krn*18krn) is large, each GVI include several types of land cover. Each land cover has its own VI. To calculate VI accurately, it is necessary to take account of not only forest cover but also other land cover. But it is very difficult to collect several types of land cover map on country scale. Since in this study only forest cover map was took accounted with, it is possible other land cover affect sigma GVI.
Referencing land use by province of Thailand agricultural census in 1985(5), in climatic region A, or southern part of Thailand 20% area is covered by land use item, or 'under fruit tree and tree crops",
while other climatic regions have small area about this item. In case that VI in this item is more similar to VI in forest than VI in other items for example, paddy land, sigma GVI would increase and it would be difficult to recognize forest cover using sigma GVI. Besides climatic region A has long coast line. Since GVI is low in ocean, GVI in coast line is low. This would cause small GVI.
5. Conclusion
In this study, effect of forest cover on annual total GVI in 5 climatic regions and effect of humid .months on annual total GVI were clarified- .
For further study, it is better to collect forest and land cover map which are produced on larger scale and have more details category, and to use not only VI but also several channel of NOM LAC or GAC .data in order to obtain more details.
References
- A.S.Belward, J.P.Malingreau, etc.(1991) Remote Sensing and Geographical Information Systems .for Resource Management in developing Countries, 169-187p, 253-278p, ECSC, EEC, EAEC, Brussels and Luxembourg.
- John, J.K.(1992),Global Ecosystems database User's Guide, National Oceanic and Atmospheric Administration(NOAA), Colorado.
- Katherine B. Kidwell(1990) Global Vegetation Index User's Guide 30 pp, NOAA, Washington. D.C. r:
- N, M.C., et al., (1991) The Conservation Atlas of Tropical Forests: Asia and the Pacific, 224-225p, Macmillian press Ltd., London and Basingstoke.
- Office of Agricultural Economics(1987), Agricultural Statistics of Thailand crop year 1986/87, etc Bangkok.