| GISdevelopment.net ---> AARS ---> ACRS 1995 ---> Poster Session 1 |
Application of Rs and GIS for
Forest-Steppe and Dry-Steppe Geosystem Study
M.Ganzorig, H.Tulgaa,
D.Amarsaikhan, B.Enkhtuvshin
Informatics and RS Centre of Academy of sciences av.Enkhtaivan-54B, ulaanbaatar-51, Mongolia
Abstract Informatics and RS Centre of Academy of sciences av.Enkhtaivan-54B, ulaanbaatar-51, Mongolia
Different airspace experiments for various scientific and economic purposes have , been carried out in Mongolia using remotely sensed data taken from different ; platforms and materials of the ground measurements. The investigation of the physical condition of a geosystem in past and present time is one of the urgent tasks of many researchers dealing with earth sciences. Our aim in this study is to .investigate two different geosystems in Mongolia. To reach the goal the diverse data were compiled within the ERDAS and ILWIS-systems and various RS and GIS techniques were applied .
1 Introduction
The result of the various experiments, carried out on Mongolian territory, with the aim of exploring the environment and mineral resources by methods of remote sensing indicated indeed great opportunities for the application of remotely sensed date to solve the problems, associated with the environmental protection and earth sciences within such comprehensive area (1.565 mil. sq. km) having various natural surroundings and unique geosystems (Ganzorig et al. 1994). Among the methodical problems of RS the main attention has been paid to the thematic cartography and the study of the physical conditions of a geosystem. If the first is the traditional, then the latter is the new one related with the space monitoring of environment. In this case, the aim of RS. is to measure different characteristics of the geosystem whose investigation should be based on a systematical approach requires an implementation of a GIS which is a management tool of geographical and other spatial related information for some decision making process. Within the scope of our research, forest-steps and dry-steppe geosystems have been analyzed. As a case study the following areas have been selected :
Tsagaantolgoi, where the basic attention was paid to the investigation of the forest-steps geosystem and estimation of its condition;
Tumentsogt, where the aim was the study of the dry-steppe geosystem, its pasture degradation, soil erosion and soil saltiness;
To develop the GIS we have designed two types of databases (spatial and attribute) in different levels and for their implementation and final analyses different RS as GIS techniques were used.
2. Databases
We have designed, databases in 3 different levels: satellite, air and ground. The satellite level is based on the middle scale maps (1 : 200,000), the air level is based on the larger scale airborne data( 2 : 25, 000) The ground level is based on the data collected through field investigation. Generally the proper physical implementation of the conceptual model is very simple within the ERDAS domain because we need not to define topology to find spatial relationships or posted identifiers to join various attribute tables. Initially, in order to get the right georeference digital images in different levels were geometrically corrected to Gauss-Kruger map projection using topographic maps of the test areas corrected to gauss-Kruger map projection using topographic maps of the test areas (Ganzorig et al. 1994). All maps, except the topographic maps were converted to digital form by video scanning using a CCD camera. Then they were resampled into digital form by video scanning using a CCD camera. Then they were resampled into the geometrically corrected digital images. After that was one screen digitizing of each map using the DIGSCRN-module of the ERDAS-system. Within the GIS the entities should be uniquely identified and have a set of attributes. In our case the ordering numbers (#) of the classes of object served as the identifiers or keys. Some attribute tables were designed in Dbase-IV saturation enhancement and 3D view ere implemented within the ILWIS environment.
Source materials
Different maps for the test areas are described as follows and RS data are shown in Table 1
Tsagaantolgoi area
- Topographic maps , scales, 1:100,00 : 50,00; 1:10,00
- Soil map, scale 1 : 200,000
- Geological map, scale 1 : 200,000
- Natural landscape (geocomplex)map, scale 1 : 200,000
- Pasture vegetation map, scales 1 : 200,00
- different ground truth data and field materials.
- ground spectrometrical data
- Topographic maps, scales 1 : 50,00; 1:25,000
- Soil map, scale 1 : 200,000
- Natural landscape ma, scale 1:200,000
| RS data | Spectral Resolution | Spatial Resolution | Swath width | Date |
| KFA-100 | panch. | 5m | 75 km | 1985 |
| MSU-SX | panch. | 240m | 600km | 1990 |
| MSU-E | 3 bands (vis., NIR) | 40m | 40km | 1990 |
| AFA | panch | 1:33,000 | 1962, 1963, 1975 | |
| MSK-4 | 4 bands (vis. NIR) | 1 : 25,000 | (07-08).1990 | |
| SPOT-XS | 3 bands (vis., NIR) | 20m | 60km | 1986 |
3. Test Site 'tsagaantolgoi'
Tsagaantolgoi area is included into the forest-steppe zone and its landscape is divided into 5 zones, like mountainous taiga or forest (1500m-2000m above sea level (asl), mountainous forest steppe (1300m-1500m asl), mountainous steppe (1200m-1400m asl), mountainous steppe (1000m-1200m asl), dry steppe and meadow steppe in the river valley and between the mountains (Ganzorig et al. 1995). The objectivity of the separation of the natural boundaries between the natural landscape subdivisions is defined by the availability of the information extracted from various RS data. In this area a large scale photograph taken by the 'KFA-1000' photo camera from the series of the Russian satellite cosmos' with a high spatial resolution was used as a basis for the differentiation between the objective contours and defining the quantitative relationships between the objective contours and defining the quantiative relationshios between the natural landscapes. After applying some corrections to make more clear the boundaries between the objects different gradient and high pass filterring techniques were applied. After that, on the basis of knoweldge about the area and other teematic information, in the enhancdd image the geocomplex features were digitized using DIGSCRN-module and was created a natural landscape map containing the relationship between the natural components (eg, relief, soil, vegetation, etc.) of the forest-steppe zone in Mongolia (Fig.1).
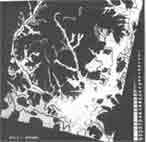
Figure 1 Natural landscape (geocomplex) map. 1. Larch-tree taiga, 2. Cedar-larch taiga, 3. Birch-larch subtaiga, 4. forest with mezophit grasses 5-7. Forest-steppe with different stow modification, 11-21. Dry steppe with different stow modification, 22-25 Dry steppe and bottomland meadow with different stow modification.
From the interpreted natural landscape map it is clearly seen that a set of stow combination in the western and north-western parts of the test area is significantly distingueshed from that in the eastern and southern parts. Therefore, in order to find out the reason for these differences and check how much it is real in large territory, we have used MSU-SK digital data and for its quality improvement destriping and low and high pass filterings have been applied (Fig.2).
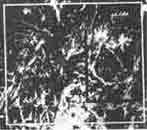
Figure 2 Natural rregionalization. I. Selenge forest-steppe middle mountain and basin subprovince with regions: I-1 Buteelin forest and forest steppe, I-2 Selenge rivers dry steppe, I-3 Buren taigaforest, I-4 Burgaltain dry steppe. II. Orkhon-Tuula dry steppe: II-5 Enkhtal forest steppe, II-6 Tuula dry steppe and meadow, II-7 Orkhon-Kharaa dry steppe.
The investigation of the most general tonal and textural differeces of MSU-SK image indicated that there are along the north-western parts of the territory 6 types and subtypes of the natural landscapes, consisting of dozens and hundreds of stows, whereas in the southern and eastern parts were only 2-3 types of geocomplexes from the not rich combination of stows and used for husbandry mainly in agriculture. MSU-SK data helped us to make clear the following basic natural laws:
a) to determine the above mentioned differences related with the bioclimatic and anthropogenic influences;
b) to identifly in detail the morphostructure in the regional level and geologicotectonic formation clearly appeared in the relief of the territory with large area.
On the basis of these natural laws geosystems of middle taxonomical level (natural subprovinces and rregions) have been detected. The further analyses require the application of multispectral data. To get the best colour image different spectral enhancement techniques have been applied to the MSU-E data and the best rresult eas obtained by the use of the saturation enhancement. To apply this technique, after sum normalozation, 3D RGB data was mapped to the 2D colour triangle, removing the influence of the intensity. Within the triangle, at first the data cloud was shifted to the origin, to make a colour balance and then spread throughout the feature space to use all possible colours.
Then to improve the interpretation and detection of the object boundaries high pass filtering and some normalozations have been applied. Colour differences in the enhanced image indicated the local variants of geocomplex structures and some landuse types and allow to group geocomplex types (Fig.3a). Making a querry using GISMO-module we bave obtained a map of the grouped natural landscapes coincided by the basic landuse types, as pasture, agriculture, etc. (Fig.3b).
As seen from Fig.3 pasture is dominant in the forest-steppe zone of Mongolia. At the same time there are some separately existing agricultural lands and small groups of fields chaostically scattered basically in the dry-steppe pasture lands.
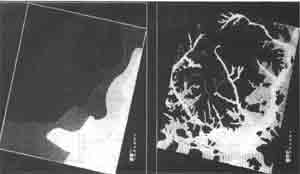
Figure 3 Local variants of natural landscape and coincided land types. A: 1. Middle mountain taiga, 2. Saddle meadow steppe, 3. low mountain forest and forest-steppe, 4. Hills low mountain steppe. 5 & 7. Oval plain dry steppe, 6 basin -vally dry steppe and bottomland meadow. B: Forest land: 1. Taiga, 2. Herbaceous forests, Natural fodder and arable arable land: 3. Pastures, party used for the haymaking, 4.Summer pasture, 5. Spring-Autumn pasture, 6. Spring-Autumn-Winter pasture, 7. Summer-Autumn pasture, 8. Spring-Winter pasture and partly haymaking.
In this area, except pastures werre considered such types of landuse, as irrigated For the investigation of some changes in the land resources we compared two subparts in the images taken in 1982 (Cosmos) and in 1990 (MSU-E). In result, the formation of the new landuse types which allowed to get information about the dynamics of the physical condition and usage of land resources for almost 10 years was detected (Fig.4).
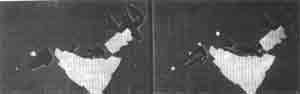
Figure 4 Land resources changes a - results of interpretation from cosmos photoimage (1982) b - results of interpretation from MSU-E (1990) digital data
As seen from Table2, by the interpreted from the satellite image features it is possible to distinguish not only the acting irrigated and non-irrigated fields , Also to calculate the increased salty, sandy and non-irrigated fields and decreased pastures and fallows.
For this aim we used a digital elevation model(DEM) of the area. To create it, contours were digitized at 50m intervals from the topographic map, scale 1:100,000 and interpolated in every 10m. After applying masking, overlaying and enhancement techniques we have illustrated landuse changes for 10 years using cosmos, MSU-E and MSK-4 data (Fig.5b).
In the test fields a methodology to use air data for the investigation and , mapping of the landuse types was elaborated.
| RS data | irr. land | ir.l w.f.of sd&st. | non-irr. land | n.irr.l with f. of sand | virg.l and fallows | beat.p. around w. camp | bea.l arou. vill | gar. | past. and hay. |
| COSMOS (1982) | 3097.8 | 0 | 1180.3 | 0 | 1172.8 | 16.32 | 214.2 | 0 | 18382.7 |
| MSU-E (1990) | 2943.0 | 151.9 | 1293.4 | 36.9 | 1019.2 | 28.32 | 282.7 | 32 | 18276.9 |
For this aim MSK-4 air data have been used and different enhancement, feature ,. extraction (principle component analyses, sum and vector normalization, etc.) and classification (minimum distance, maximum likelihood, etc.) techniques were .applied to study pasture and soil degradation.
The methodology allowed to increase in detail the accuracy of the object separation. In the air image the main attention has been paid to the investigation of the nature of the boundaries not always having homogenious expression, specially for the objects mixed with those which are naturally anthropogenically originated (Eg, beaten land close to the inhabited places, beaten pasture around the winter camps, etc.). For the determination of the exact boundaries between different lands it is necessary to quantitatively analyze cartographic and other materials.
More changed by cattle herding, vegetation groups coincide with winter camps, wells, herding and to settled areas. In our analysis was established that the zone of the influences of the winter camps the condition of the natural vegetation is within the distance of 1-2km. This zone is well expressed in the multispectral data.
Intensification of the developing agricultural productions influenced the r ploughing in the large area, especially in the chestnut and dark chestnut soils of the valley-basins and slopes because the slope, water and wind erosions of the soil have been increased.
Through the principle component analyses and saturation enhancement and filtering techniques we have obtained information on qualitative containt of, the separate contours and detected some new objects . In the panchromatic image this zone is not detected and through the field work it was also not distinguished from the r surroundings. However, the fixation of such objects is vitally important as an indicator for the possible degradation of the pastoral vegetation and soil erosion and also as an index for the forecasting of the ecological situation in r the region.
From these analyses it is seen that the investigation and mapping of the natural landscapes and their application in agriculture allow us to carry out classification of the objects by the different features with high confidence.
4. Test Site 'tumentsogt'
Initially, digital MSK-4 photoimages were mosaicked and then radiometrically & geometrically corrected. After applying spectral enhancement techniques different low and high pass filterings were used. In comparison with the filters used in other test areas in this polygon the bigger size kernels (7x7 9x9 and larger) were applied.
The results of the analysis indicate that in the non-irrigated plough land of the dry-steppe zone degradation processes have been detected such as the intensification of the sandy fields related to deflation and increase of the stained (heterogenious) fields, associated with the phoughing of the carbonate horizon. comparing the degradation processes in this area and in the mountainous forest-steppe zone one can observe that the degradation process in the Tumentsogt polygon is stronger than in the Tsagaantolgoi area. This is related with the following factors: 1) the mechanical composition and the depth of plough horizon of the soil. 2) the strength and direction of the wind.
Conclusions
In result of the creation of the geocomplex map there was established that the limit he natural landscape mapping by the use of the large scale RS data is with in the level of the stows and further geographical differentiation until the level of facies requires an application of aerial data.
Taking into account the specification of the photoimages reflecting the pecularities of the modern distribution of the landuse types related with the local variants of the geocomplexes in each natural region it is concluded that the usage of land resources in the territory is totally submitted to the existing natural laws
During the analyses in the 'Tsagaantolgoi' area has been established that due to the developing agricultural productions slope, water and wind erosions of different soils have been increased.
These analyses show that the investigation and mapping for the natural landscapes and their application in agriculture allow to carry out classification of the objects by the different features with the high confidence.
The analysis in the 'Tumentsogt' area indicated that the degradation processes in the mountainous forest-steppe zone are weaker than in the dry-steppe zone.
As seen from our investigation, multitemporal and multisource data with the application of RS and GIS techniques can be effectively used to study the conditions of the natural-territorial complexes in different reg1ons. Such analysis can be applied for the natural objects' study in the comprehensive I area related global change monitoring of the Earth.
References
- Ehlers, M., Greenlee, D., smith, T., and star, J., 1991, Integration of RS and GIS, Data and Data Access, PE & RS, Vol.57, No.6, 669-677.
- Ganzorig, M., Amarsaikhan, D., and Enkhtuvshin, B., 1992, An Application of Remote sensing and GIS Technique in Mongolia, European 'International Space Year' Conference 1992, Munich, Germany.
- Ganzorig, M., Amarsaikhan, D., Enkhtuvshin, B., Tulgaa, H., 1994, Design of A Multilevel Database using RS and GIS Techniques, Proceedings of the ACRS, Bangalore, India.
- Ganzorig, M., Adyasuren, Ts, 1995, Application of RS and GIS for Ecosystem Monitoring and Management, paper presented at the International Seminar on Space Informatics, Ulaanbaatar, Mongolia.
- Manual of Remote sensing, 1983, American society of Photogrammetry Second Edition, volume 1.