| GISdevelopment.net ---> AARS ---> ACRS 1995 ---> Poster Session 1 |
National-Wide Environmental
Unit Classification using Remote Sensing and GIS -A Case Study in Zambia
Ryota Nagasawa, Kazushi
Endo, Yoshinori, Takahashi Yukiko Kojima
PASCO Internatlonal Inc.
3-7-8 Kammiuma, Setagaya-ku
Tokyo, 154, Japan
Tel : 81-3-34 13-9321 Fax : 81-3-34 13-9805
E-mail :34153274@people.or.jp
Abstract PASCO Internatlonal Inc.
3-7-8 Kammiuma, Setagaya-ku
Tokyo, 154, Japan
Tel : 81-3-34 13-9321 Fax : 81-3-34 13-9805
E-mail :34153274@people.or.jp
For the purpose of structurally understanding the regional ecosystems, natural environmental factors, consist of geomorphology, geology, land cover, elevation, annual precipitation and evapotranspiration , were data based and combined so as to divide the national area into environmental units or zone. Quantification theory III is applied in multivariate analysis, in which qualitative data (categorical data) relating to each environmental factor, because it was proved to be effective in graphically expressing and categorizing the samples based on the patterns of reaction of sample data categories. Mesh (grid) data, which are used for multivariate analysis, on a size of 1 km (totally numbers 7,522) were prepared through vector / raster conversion of the established database. As a result of analysis, the study area, the Republic of Zambia, can be divided into 10 environmental units reflecting the mutual interrelations between 6 environmental factors. The result almost totally matches with existing ecological viewpoints and can be said with great confidence to be proper and correct.
1. Introduction
It wasn't until the late 1980s that the world sat up and started to show concern towards global environmental issues. Problems such as global warming, destruction of the ozone layer, the depletion of forests and desertification caused by
Acid rain each differ in their effects, ranges and features, however, the solution to these problems can be said to be largely dependent on the actions of every individual human being and the degree of environmental management on the local and regional levels. When people come to plan and implement regional development projects in the future, they will have to pay attention to the global environment and give ample consideration to environmental plans aimed at the preservation and revitalization of regional ecosystems.
Regional environments are composed of single ecosystem that is formed from the delicate relationship of a variety of environmental factors such as topography, geology, soil, climate and flora and fauna. This means that it is necessary to spatially unify environmental factors in order to be able to understand the regional ecosystem. This report aims to give an introduction to methods for obtaining a structural understanding of regional ecosystems, seen from the regional environmental viewpoint, through the use of remote sensing and GIS technology.
2. Study: Area
The whole of the Republic of Zambia, located in south-central Africa and covering an area of 752, 612 m' , is the area of study. Most of the national land area of this country is situated on geographically the Zambezi River and its tributaries, there are steep fault escarpments and tectonic valleys that result form the tectonic structure of the rift valley.
Zambia is located within the tropical zone, however, the high altitude ensures that the climate is comparatively cool throughout the year. The vegetation land cover in Zambia is broadly classified as savanna, but within this classification, some district differences are identified due to the type of soil, gradient, altitude and climate.
3. Methodology
The methodology used here consists mainly of regional area division methods that utilize multivariate analysis. As statistical means form the basis, an overlay-like spatial analysis model enables, not only elimination of the arbitrariness (subjectiveness) that often occurs in the stage of environmental factor unification, it also allows a quantitative understanding of factor cause and effect interrelationships to be gained in those cases where numerous environmental factors exist. In this study, natural environmental factors (topography, geology, land cover information, etc.) were combined to divide the study area into environmental units or zones, and an attempt was made to gain a structural understanding of the mutual cause and effect relationships of environmental factors. Quantification III theory is utilized in multivariate analysis, in which qualitative data {categorical data) relating to Geomorphology, geology and land utilization, etc. is used.
Quantification III methodology involves the quantification of both samples and categories based on the patterns of reaction of sample data categories, and it is intended to graphically express and categorize those samples and categories. This method was originally proposed by Dr. Hayashi in 1983 and proves useful in classifying and finding out about samples and categories. In this study, the six types of map data {qualitative data) of elevation, geomorphology, geology, land cover, annual precipitation and evapotranspiration were used in carrying out regional area division in terms of environment, in order to gain an understanding of environmental units. Fig.-1 illustrates the analysis flow formed by this qualitative data.
Fig.1 Analysis Flow Chart
4. Spatial Data Preparation
In developing countries such as Zambia, it is often difficult to obtain latest national land information {geomorphology, geology, land cover, etc.) on a comprehensive scale and with a unified degree of accuracy. In the case of this study, however, remote sensing data {LANDSAT TM 41 scenes), covering the whole territory of Zambia, were obtained, and those original images were processed and interpreted in order to prepare geomorphological, geological classification and land cover maps on a scale of 1 :500,000. As a result, vector based data base were established using GIS. Moreover, existing data on elevation, precipitation and evapotranspiration were also digitized to eventually construct six types of thematic map data bases {see Fig. 2).
Fig.-2 Thematic Database
Legend of Thematic Maps
Mesh {grid) data, which are used for multivariate analysis, on a size of 1 km were generated through the vector / raster conversion of the thematic maps. The resulting sample mesh data numbers 7.522 units in all and consists of the aforementioned six environmental factors {items). The six items of elevation, geology, land cover, annual precipitation and evapotranspiration are each divided into 7-9 separate categories. The items, their categories and the numbers of samples are listed on Table-1.
| Environmental item | Environmental category | Sample | Environmental Item | Environmental category | sample | ||
| Geomorplogy | 1 | Montane Zone | 2 | Landcover | 1 | Forest | 923 |
| 2 | Degraded plateau | 4,157 | 2 | Grassland | 4,197 | ||
| 3 | Aggraded plateau | 1,893 | 3 | Savanna | 2,072 | ||
| 4 | Escarpment | 13 | 4 | Barren | |||
| 5 | Escarpment complex | 672 | 5 | Agriculture | 151 | ||
| 6 | Dissected trough floor | 313 | 6 | Wetland | 64 | ||
| 7 | Flat trough floor | 389 | 7 | Urban | 3 | ||
| 8 | Lake | 63 | 8 | Water | 112 | ||
| Elevation (m) | 1 | 300 ~ 500 | 50 | Annual Precipitation(mm) | 1 | ~ 700 | 213 |
| 2 | 500 ~ 700 | 457 | 2 | 700 ~ 800 | 1,030 | ||
| 3 | 700 ~ 900 | 373 | 3 | 800 ~ 900 | 1,234 | ||
| 4 | 900 ~ 1100 | 2,511 | 4 | 900 ~ 1000 | 1,399 | ||
| 5 | 1100 ~ 1300 | 2,998 | 5 | 1000 ~ 1100 | 1,120 | ||
| 6 | 1300 ~ 1500 | 949 | 6 | 1100 ~ 1200 | 989 | ||
| 7 | 1500 ~ 2000 | 184 | 7 | 1200 ~1300 | 992 | ||
| geology | 1 | Lithological unit of various ages | 1,142 | 8 | 1300 ~ | 545 | |
| 2 | Older precambrion | 1,206 | Evapotran spiration(mm) | 1 | ~ 1900 | 603 | |
| 3 | Precambion rocks of uncertain age | 67 | 2 | 1900 ~ 2000 | 1,050 | ||
| 4 | Muva | 560 | 3 | 2000 ~2100 | 1,418 | ||
| 5 | Late Precambrian and Lower paleozoic | 1406 | 4 | 2100~2200 | 1,096 | ||
| 6 | Upper Carboniferous to Jurassic | 602 | 5 | 2200~2300 | 932 | ||
| 7 | Tertiary | 1841 | 6 | 2300~2400 | 856 | ||
| 8 | Quarternary | 585 | 7 | 2400~2500 | 1,020 | ||
| 9 | water | 113 | 8 | 2500~ | 547 |
5. Natural Environmental Factor Interrelationship
Cramer's coefficient of association between the items was obtained in accordance with the square of c; (solution), which was found through the cross tabulation of the sample data (see Table-2), in order to understand the strength of the mutual relationships (links) that exist between the environmental items. The largest value obtained is the 0.547 that exists between geomorphology and geology, and this is followed by the 0.411 that exists between geomorphology and elevation.
| Precipi- tation |
Evpotran- spiration |
Geology | Geomorpho- logy |
Landcover | Elevation | |
| Annual precipitation | 1.0000 | 0.3676 | 0.2580 | 0.1954 | 0.1027 | 0.3057 |
| Evpotranspi- ration |
0.3676 | 1.0000 | 0.2566 | 0.2406 | 0.1174 | 0.2897 |
| Geology | 0.2580 | 0.2566 | 1.0000 | 0.5499 | 0.3998 | 0.3863 |
| Geomorpho- logy |
0.1954 | 0.2406 | 0.5470 | 1.0000 | 0.3263 | 0.4111 |
| Landcover | 0.1027 | 0.1174 | 0.3998 | 0.3263 | 1.0000 | 0.1614 |
| Elevation | 0.3057 | 0.2897 | 0.3863 | 0.4111 | 0.1614 | 1.0000 |
Furthermore, the matrix, which is formed by Cramer's coefficient of association, became the basis for the factor analysis as a correlation matrix. The aim of the factor analysis was to find out which factors are the fundamental ones. As a result of this, as can be seen in Fig.-6, it was possible to broadly divide the environmental items into two groups; the first factor group consisting of the land-related items of geomorphology, geology and land cover, and the second factor group consisting of the climate-related items of annual precipitation, evapotranspiration and elevation (see Fig.-3).
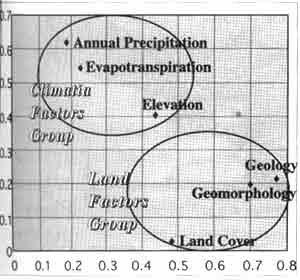
Fig.3 Grouping of Environment Factors based on Factor Analysis
6. Environmental Unit Classification bv Cluster Method
First, Quantification theory III was applied using the sample categories as variables. Regarding the axis unique values and contribution ratios, an accumulated 21.5% is explained up to three axes, as shown in Table-S. Next, the sample weight matrix
| Axis | Eigenvalue | Coefficient of Contribution | accumulation | Correlation Coefficient |
| 1 | 0.4727 | 7.9 | 7.9 | 0.6875 |
| 2 | 0.4363 | 7.3 | 15.2 | 0.6605 |
| 3 | 0.3763 | 6.3 | 21.5 | 0.6135 |
| 4 | 0.2467 | 4.1 | 25.7 | 0.4967 |
| 5 | 0.2410 | 4.0 | 29.7 | 0.4909 |
obtained in Quantification III were used in carrying out cluster analysis (Ward method). As a result of this, it was possible to classify the environmental units into 10 groups (Group A -Group J) as shown in Table-4 and Fig.-4 Looking at these environmental unit groupings for the whole of Zambia shows that, with the focus being placed on topography, they accurately reflect the land classifications together with the geology and land cover, which are discernible in the aggradated and degraded areas of the Central African Plateau and the fault valley bottoms and escarpments that lie along rift valleys. These results almost totally match with existing ecological viewpoints and can be said with great confidence to be proper and correct.
Fig. 4 Environmental Unit Classification Map
| Environmental Item | Group A | Group B | Group C | Group D | Group E |
| Geomorphology | Aggraded Plateau | Degraded plateau | Degraded plateau | Degraded plateau | Aggraded Plateau |
| Geology | Tertiary | Upper carboniferous to Jurassic | Order Precambrian | Order Precambrian | Tertiary |
| Land Cover | Grassland | Grassland - Savannah | Grassland Savannah - forest | Savannah Grassland | Grassland Savannah - forest |
| Elevation | Middle | Middle | Middle | Middle | Middle |
| Precipitation | Middle | Middle - Much | Middle | Middle | Less - Middle |
| Evapo-Transpiration | Middle | Low-Middle | Low | Low | Low-Middle |
| Environmental Item | Group A | Group B | Group C | Group D | Group E |
| Geomorphology | Aggraded Plateau Degraded plateau | Aggraded PlateauDegraded plateau | Desected trough Floor Escarpment Complex | Lake | Flat Trough Floor Dissected trough Floor |
| Geology | Tertiary | Upper carboniferous to Jurassic | Upper Precambrian to lower Paleozoic | Water Body | Grassland |
| Land Cover | Grassland - Savannah | Grassland - Savannah Forest - Agriculture | Grassland - Savannah | Water Body | Grassland |
| Elevation | Middle-High | Middle | Low | Middle | Low |
| Precipitation | Less | Much | Less-Middle | Much | Middle |
| Evapo-Transpiration | Low-Middle | Middle-High | High | Middle-High | Middle |
Reference
- K. Takeuchi and A. Tsunekawa (1994) : Environmental Resources and Information System ( in Japanese ), Kokon Shoin, 219pp.
- K. Takeuchi, A. Tsunekawa and H. Ikeguchi (1990 Numerical Classification of Natural Regions of Japan, Geogr. Rep. Tokyo Metropol. Univ , No.25, 269- I 287 .
- J. Townshend (1991) Environmental database and I GIS. In: D.Maguire et al (eds) Geographic Information System: principles and applications, . Vol.2, Longman, 201 .216 .