| GISdevelopment.net ---> AARS ---> ACRS 1995 ---> Land Degradation |
Monitoring Global Vegetation
Degradation Using NOAA NDVI Data
Shiro Ochi8* Shunji
Murai**
* Utsunomiya University
350 Mine, Utsunomiya, 321, Japan
E-mail:mailto:ochi%20@cc.utsunomiya-u.ac.jp
**Asian Institute of Technology
GPO BOX 2754, Bangkok, 10501, Thailand
Fax:+66-2-524-5721
Abstract* Utsunomiya University
350 Mine, Utsunomiya, 321, Japan
E-mail:mailto:ochi%20@cc.utsunomiya-u.ac.jp
**Asian Institute of Technology
GPO BOX 2754, Bangkok, 10501, Thailand
Fax:+66-2-524-5721
Seasonal NDVI Data generated from NOAA A VHRR data with 8km spatial resolution show unique. fluctuation patterns based on vegetation types and meteorological and topographic conditions. By analyzing- the NDVI fluctuation patterns, vegetation degradation is estimated. In this study, Vegetation Degradation Index( V Dl) which is proposed to figure the global vegetation degradation, is calculated using the NDVI data for a decade and several kinds of geographic information in global scale those are soil, elevation, climate, etc. V Dl is applied to assess. the global land degradation which is difficult to be monitored directly with only remotely sensed data.
Introduction
The importance for assessment of land-degradation and desertification are pointed out in Agenda-21 however, the methodology by means of Remote Sensing technology with GIS is not established. Some studies about drought and desertification in Africa using NOAA A VHRR, and the results are that long-term observation for several decades is required for the assessment of desertification and land degradation in global and continental scale. (Justice, et al, 1985, Tucker, et al, 1986). So the vegetation degradation instead of land degradation is assessed in this study, because it is more possible to assess by remotely sensed data, and it is considered to be very close relation with land degradation and desertification.
Two approach can be considered for the assessment of vegetation degradation. One is to monitor in global scale, and the other is in local scale. For the global scale, NOAA data is suitable for analysis. GVI which is 10 minutes spatial resolution(approximately 16km pixel size) NDVI data, and 8km NDVI data are available. GAC data which is 4km pixel size is going to be available in a few year. And 1km land cover monitoring project and Landsat Pathfinder Project are now going on. By using these data, the tendency of vegetation degradation can be found because these data are available for a few decades spans. In local scale, it would be impossible to find the process of land degradation and desertification by using SPOT and/or LANDSA T -TM data because such a long term observation had not been made by these sensors. However, the high spatial resolution data can show the current status of the land degradation and desertification.
In this study, long term observation to find the tendency of land degradation in global scale by using NOAA.
NDVI data. The objectives of this study are
- To understand the characteristics of NOAA monthly data those are in scale of approximately 16km using ::~"j, GVI and 8km NDVI, and
- To develop the methodology to assess the vegetation degradation in global scale. ;
Data used in this study were extracted from NOAA Global View Dataset, those are]
1. Monthly GVI data, from April 1985 to December, 1988(45 months)
2. Leemans and Cramer IIASA Climate data(30 minutes pixel resolution)
- Average Monthly Air Temperature
- Average Monthly Precipitation
4. Monthly NOAA NDVI data ( 8krn pixel resolution)
And NOAA NDVI data with 8km spatial resolution was used.
In order to use GVI data for monitoring vegetation degradation, the quality of the GVI should be examined. Figure-1 shows the mean value of total of GVI and the number of pixels which are not zero value in the images. This means that the GVI is not standardized in the period, and it looks to be brighter year by year . However the procedure to generate the data is not clarified in our site.
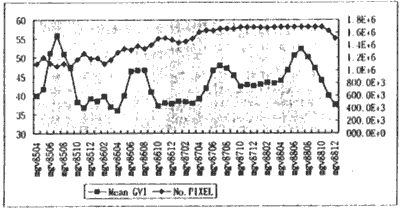
Figure-l. Mean OVI
3. Methodology
It is very hard to understand the vegetation degradation from the Figure-l. In this study, the GVI characteristics are drawn by overlaying with the above mentioned eco-regions map. By making fluctuation pattern of mean GVI for each eco-regions category , the vegetation growing and declining patterns can be found.
After making the vegetation fluctuation pattern for each category, a vegetation degradation index is defined. ; In this study the index is proposed to indicated the vegetation degradation tendency. In the Figure-2, the line ;" is define to fit the formula (1). The vegetation degradation index is define as "a" described in f(x).
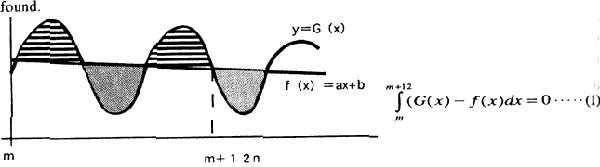
Figure-2
4. Results
Figure-3 shows the vegetation fluctuation patterns for some ecoregion categories. The tendency of GVIdynamics can be easily known from the graphs.
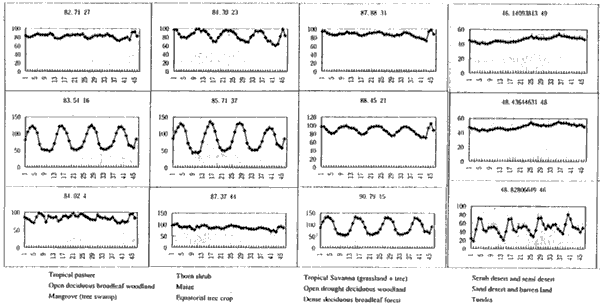
Figure-3. GVI Fluctuation Patterns by eco-regions categories
Table-l shows the calculated vegetation degradation index. Minus value of the index means that the tendency: of vegetation activity is declining. So the less the vegetation degradation index shows, the more the vegetation degradation is proceeding. Generally, the categories those average of GVI are low have the tendency to increase the vegetation activities, and the categories those average of GVI are high have that to decline the vegetation activities.
| VDI Categories | VDI Categories |
| 0.33 Ice | -0.18 Urban |
| 0.22 Semi arid rough grazing | -0.20 Tropical savanna |
| 0.22 Sand desert and barren land | -0.21 Open drought deciduous woodland |
| 0.21 Tundra | -0.25 Dense droght deciduous forest |
| 0.21 Scrub desert and semi desert | -0.31 Thorn shrub |
| 0.21 scrub desert + scattered trees | -0.34 Equatorial tree crop |
| 0.20 Irrigated cropland | -0.37 Tea |
| 0.20 Dwaf shrub | -0.42 Coffee |
| 0.16 Vineyard | -0.44 Open tropical woodland |
| 0.16 Vineyard | -044 Open tropical woodland |
| 0.16 Temperate rough grazing | -0.44 Equatoria rain foreat |
| ..... ...... | -0.55 Dense evergreen broadleaf forest |
Figure-4 shows the global map of the vegetation degradation index. Large area are affected by degradation in South America, especially the central Amazon, and the LaPlata River basin, middle Africa, and South East Asia. It looks strange that the low vegetation degradation index area can be seen in Japan. The output is considered to be reasonable in the tropical regions.
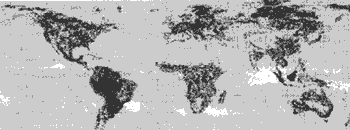
Figure-4. Vegetation Degradation Index Map by eco-regions categories
5. Conclusion and Discussion
OVI fluctuation patterns could be recognized by overlaying the long-term NOM NDVI data and eco-regions map. By using the pattern graph, a vegetation degradation index was proposed which is showing the trend of vegetation degradation in global scale. However, the land degradation as well as vegetation degradation are considered to happen with area of several hectares to several square kilometers, depending on the types of degradation. So the s[spatial resolution is expected to be improved.
The index is showing reasonable output about the vegetation degradation in the tropical area where the mean OVI is rather high, however, some part of temperate zone such as Japan is recognized as the area where the degradation is proceeding. To correct such error, statistical modification to the original OVI is recommended , to be made.
References .
- Justice, C.O., Townshend,J.R.D., Holden,B.N. and Tucker,C.J., Analysis of phonology of global . vegetation using meteorological satellite data, INT.J. Remote Sensing, 1985, vo16, No8, 1271-1318
- Tucker,C.J.,Maximum Normalized Difference Vegetation Index Images for sub-Sahara Africa for 1983- 1985, INT.J. Remote Sensing, 1986, vol.7, No.11, 1383-1384