| GISdevelopment.net ---> AARS ---> ACRS 1995 ---> Land Degradation |
Mapping of Salt-Affected
Soils using Remote Sensing and Geograp Information Systems: A Case Study
of Nakhon Ratchaslma, Thailand
Awadh k. sah, Apisit
Eiumnoh, Shunji Murai and Preeda Parkpian
Space Technology Applications and Research Program,
Asian Institute of Technology
GPO Box 2754, Bangkok 10501, Thailand
Abstract
Space Technology Applications and Research Program,
Asian Institute of Technology
GPO Box 2754, Bangkok 10501, Thailand
This paper is based on a research carried out to develop a methodology to classify the salt-affected soils using remote sensing and GIS. Taking salt crust as a criterion, Landsat TM with bands other than two and six was found effective, to a greater extent, in classifying the extremely and moderately saline area. Integration of GIS was found effective in classifying low and potential saline area as well as in correcting some of such area misclassified as extremely or moderately. The confirmation of resulted six salinity classes with field check, existing map and soil analysis proved it as reliable one. However, similar pattern of soil salinity was obtained from the study compared to the existing map of 1989 prepared from Landsat MSS at scale 1: 250, 000, the classification result was found to show more details. The study concluded that integration of GIS with digital image processing of TM was very effective for classifying and monitoring of saline soils.
1.0 Introduction
Salt-affected soils have been identified as one of the three main hurdles against crop production in northeast region of Thailand (Mitsuchi et al., 1986) where out of3.61 million hectare of such soils in whole territory, as high as 2.58 million hectare, i.e. 17% of total regional area, is prevailing (Arunin, 1992). The widespread deforestation of past is considered as the main cause in bringing the salts from lower strata up to soil surface which despite of various control measures, has resulted in rapid expansion of salt-affected areas. Such the dynamic condition calls for up-to-date information regarding its extent and nature as pre-requisite for the sound management. Unfortunately, until present, this usually remains inadequate mainly due to lacking of efficient assessment method. However, Satellite Remote Sensing (SRS) with higher spatial resolution is now available for this purpose (Singh and Dwivedi, 1989) which in combination with Geographic information Systems (GIS) may yield more reliable result (Battle-Sales and Abad-Franch, 1992). Under this context, the present study was carried out with the objectives (i) to develop a methodology for mapping the salt-affected soils using SRS and GIS , (ii) to assess the capability of GIS for comprehensive classification when interfaced with SRS data, and (iii) to interpret the salinity classes with respect to crop production.
2. 0 The Study Area
The study area, encompassing 469 square kilometers, lies between 14° 56' and 15° 12' North latitude and 101° 53' and 102° 08' East longitude in Nakhon Ratchasima province of northeast region of Thailand. Mean annual rainfall of the locality, as revealed from meteorological data for 34 years (1961-94), is 1060 mm out of which nearly 85% occurs within six months (May to October) while along with mean monthly maximum temperature between 29.8° to 37.0°, the mean annual evaporation is as high as 1873 mm. Lam Takong irrigation project covers 20.4% of the whole study area extending mainly in flood plain and basin. The altitude ranges from 170 to 210 m above mean sea level. 85.7% of whole study area is under cultivation while forest is covering only in 1% area. Paddy and cassava are the two major crops occupying the low and up land, respectively.
3.0 Methodology
An integrated approach of digital image processing of satellite data combined with GIS was carried out in this study.
3.1 Collection of Ancillary Data
Besides the above facts, two field surveys were conducted, the fIrst mainly to observe the dominance and spatial relationship of salt crusts and the second to verify field and to collect soil samples. Following satellite data and source maps, were used: Thailand.
- Landsat-5 TM data of path/row 128-050, acquired on 10 January 1994.
- Existing Maps:
- Topographic map (scale 1:50,000) of year 1969.
- Geology map (scale 1:250,000) of year 1976.
- Soil map (scale 1:100,000) of year 1978.
- Land use map (scale 1:250,000) of year 1987.
- Ground Water Quality and Well Yield map (1:100,000) of year 1988.
- Salinity map (scale 1:250,000) of year 1989.
Various steps involved in the analysis of satellite data are presented in Fig. I. In brief, after geometric correction and linear contrast stretch, the image was visually interpreted in individual bands and various band combinations, and by applying filtration, Principal Component Analysis (PCA) and band ratioing. Supervised classification was employed with maximum likelihood, mahalanobis and minimum distance methods including the bands 1,3,4,5 and 7. Band six had poorer separation of features and band two was highly correlated with one. Unsupervised classification was also tried with sequential clustering including seven separable classes. .
Fig.1 Flow Chart Showing Various Steps Involved in Image Classification
3.3 Development of GIS Thematic Layers and Their Integration
3.3.1 Selection of Parameters
The ideology behind the selection and further classification of parameters (Table 2) were as follows
- Landform:
Among the five types of landform present in study area, virtually no salt crust is seen in high and middle race while it can be frequently seen in flood plain and basin. Lower terrace and peneplain remain somewhere in the middle. - Ground Water Quality and Well Yield:
Along with the quality ofeds to be considered for salinity assessment. Hence for overlaying purpose, the twelve classes of ground water quality and quantIty so found m study area were grouped to four by considering the expected salt quantity (in term of kg/hr) that can come out under average condition along with same operation hour. The criteria set was <1.25, 1.25 to 6.00,6.01 to 12.00 and > 12.00 kg/hr for Good (WI), Medium (W2), Worse (W3), Worst (W4) , respectively (Table I).
- Soil Drainage:
Generally, poorer the soil drainage, greater the possibility of rise in the level of perched ground water especially in low- Iying areas. - Irrigated Area:
Regular water supply to an area generally enhances the salinization by leaving the salts on soil surface and/or increasing the ground water table. This becomes more concerning factor if it contains more salt and/or ground water quality is worse. - Slope:
Generally, slope percent two or less has been reported as associated with the salinization and again one or less percent as the most serious one (Ratanavong, 1991 ).
The digitized contour lines were further processed to create Digital Elevation Model (DEM) fIrst which was used to derive slope GIS layer. Similarly, to create landform and drainage GIS layer, the digitized soil coverage was assigned with respective value. Rest of GIS files were obtained just by digitization (Fig. 2).!Integration of thematic layers was done using logical approach as employed by (Mongkolsawat and Thiragnoon, 1990).This involved the identification of saline areas where a specified combination of conditions occurred (Table 3). For the first two classes, main priority was given to landform type while for the rest classes, ground water quality and well yield was given highest consideration followed by landform and rock type. Area under , being considered as not affected by salinization themselves, were classified as Gland G2 except the irrigated one. These were further separated by assigning Rl with Wl as Gl and rest as G2. Similarly, to separate G4 and G5, further base was taken from the slope and drainage conditions. Alluvial complex with all area as R2 and IRl and majority as W3 and SL 1, was classified as G4.
Fig. 2 Flow Chart for Creating and Integrating GIS Coverages and with Image
3.3.3 Integration of Classified GIS Coverage with Image
In brief, G 1 and G2 classes having L 1 type of landform were assigned the same class name. Rest of extremely as well as moderately saline areas so classified from image were put as such while that of slight saline area was further categorized into potential (S4) and slightly saline area (S3) (Table 5). The interpretation of salinity result with respect to crop f~ production was based on the salt tolerance guidelines given by Mass (1984).
4.0 Results and Discussions
4.1 Image Analysis ~
- Visual Interpretation:
In contrast to others, band six showed darker tone for the area having >50% salt crust coverage which may be due to the discontinuity of pores/channels in soil that resulted into more moisture. Among the Various band combinations, 5,3,1 (R, G, B) had clearest distinction of salt crust area followed by standard FCC (4,3,2) and 7,5,3. The other band combinations had similar color appearance to one of above combinations. For instance, the combinations 5,3,2; 7,3,2; 7,3,1 and 5,2,1 were similar to 5,3,1. Filtering, band rationing and PCA were found no more helpful in this respect than as in above band combinations. - Unsupervised Classification:
Majority of the area (84.86% ) so classified as nearly barren and vegetative, from this classification, were not interpretative from salinity point of view (Table 4). - Supervised Classification:
Four classes viz; Extremely saline (11), Moderately saline (12), Slightly saline (S3) and Deep water bodies could be separated from this classification. Various methods had similar coverage of each class, especially maximum likelihood and mahalanobis. However, the spatial distribution of the classes was different in these two methods, too. Also, the accuracy assessment showed that maximum likelihood with standard deviation three had the highest accuracy (Fig. 3). The result was more accurate at standard deviation three than two. It can be attributed to well separablity of different features even at three. The result of maximum likelihood at standard deviation three was used for further analysis.
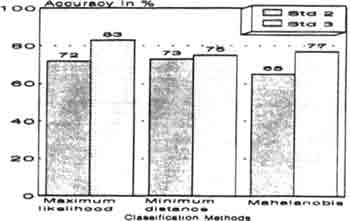
Fig.3 Accuracy of Various Methods of Supervised Classification
4.2 Analysis of Classification Obtained by GIS
Altogether, moderately and extremely salinity potential comprised as high as in 60.4% of the total area. 32.2% area found as high land, i.e. saline free but ability to make the other areas vulnerable (Table 3).
4.3 Analysis of Classification from Integration of Image With GIS
Among the six salinity classes, negligible area was found as non saline (Fig. 4) while extremely and moderately saline, altogether, were extending in nearly one third area, i.e. in dry season salt crust can be seen in such large portion. The accuracy assessment done with the sixty sites showed the over all mapping accuracy as 86.7%. Soil analysis result revealed that ECe was highly correlated with salinity classes while the correlation was lacking for pH (Table 5).

Fig.4 Soil Salinity Map of the Study Area Resulted from Present Study with the Integration of Landsat-5 TM and GIS.
The interpretation of salinity classes revealed that potential and slightly saline area can be used for various crops but due attention be given against its further increment. Moderately saline area may be suited for the production of certain crops but no more in extremely saline area. Deep rooted crops or trees would be more suitable in highland salt source area-
4.4 Comparison of Present Salinity Classification with Earlier One
The Comparison of present salinity classification with earlier one that classified in 1989 from Landsat MSS along with field survey, showed the difference in aerial extent of classes, however, various degrees of salinity had similar pattern of distribution. For instance, altogether the coverage salt crust area in both classification was nearly same, i.e. 34.1 and 34.8%, respectively (Table 5). Difference in class coverage from the two classification may be partly due to the use of different satellite data.
5.0 Conclusions
This research showed that integration of Landsat TM with GIS can be used successfully in mapping saline soils. Supervised classification of TM is useful in separating extremely and moderately saline areas up to greater extent. GIS, is useful to classify lower and non saline areas and also to correct the area classified by TM.
References
- ARUNIN, S.(1992), Strategies for Utilizing Salt-affected Lands in Thailand, Proc. of the int. Symp. on Strategies for Utilizing Salt- affected Lands, Bangkok, Thailand, Feb. 17-25, 1992, pp:259-268.
- BATLLE-SALES, J. & ABAD-FRANCH, A.(1992), Survey and Mapping of Salt-affected Soils Using Remote Sensing and Geographical Information Systems, Proc. of the int. Symp. on Strategies for- Utilizing Salt-affected Lands, Bangkok, Thailand , Feb. 17-25,1992, pp:511-518.
- MASS E. V.(1984), Salt Tolerance of Plants. In: the Handbook of Plant Science in Agriculture. B.R. Christie (ed). CRC Press, Boca, Raton, Florida.
- MITSUCHI, M., WICHAIDIT, P. & JEUNGNIJNIRUND, S.(1986), Outline on Soils of the Northeast Plateau, Thailand, Their Characteristics and Constraints, Technical Paper No. I, Agric. Dev. Res. Center in Northeast Thailand, Khon Kaen, pp:76.
- MONGKOLSAWAT, C. & THIRANGOON, P.(1990), A Practical Application of Remote Sensing and GIS for Soil Salinity Potential Mapping in Korat Basin, Northeast Thailand, Tech. Rep. Series No.8, Remote Sensing, Soil and Water Managt. in Northeast Thailand, Khonkaen.
- RATANA VONG, N.(1991), Assessing Potential Salt-vulnerable Areas Through Terrain Analysis using Remote Sensing and GIS, The Vientiane Plain Case Study, M.Sc. Thesis, AIT, Bangkok, Thailand.
- SINGH, A.N. & DWIVEDI, R.S.(1989), Delineation of Salt-affected Soils through Digital Analysis of Landsat MSS Data, Int. J Remote Sensing, 10:83-92.