| GISdevelopment.net ---> AARS ---> ACRS 1995 ---> Forest/Vegetation Mapping |
Monitoring of forest stand
condition in Thailand - Tropical; seasonal forest-
Haruo sawada, hideki
saito
forestry and forest products research institute, Japan
P.O. box 16, tsukuba-norin, ibarakim, 305 Japan
Thongchai charuppat, jirawan charuppat, Suwit Ongsomwant
Royal forestry department, Thailand
surachai ratanasermping, chaowalit silapathong national research council of Thailand.
Abstractforestry and forest products research institute, Japan
P.O. box 16, tsukuba-norin, ibarakim, 305 Japan
Thongchai charuppat, jirawan charuppat, Suwit Ongsomwant
Royal forestry department, Thailand
surachai ratanasermping, chaowalit silapathong national research council of Thailand.
The study aims to find and develop practical methodology on digital processing of satellite remote sensing data and other geographical information for observing and monitoring tropical seasonal forest area.
Around the Doi intanon, chiang mai, was selected as one of the study areas to develop forest type classification method and to delineate forest area affected by shifting cultivation.
The main methodologies of the study are (1) to make a forest type map of chiang Mai study area based on the normalized difference vegetation index (2) to establish the field check system for comparing ground measurements with the processed remote sensing data. The results are as follows: (1) The shifting one between evergreen forests and deciduous forests in 700m and 800m was found by the four landsat images and checked by the field survey. (2) a field survey system was established among the researchers concerned to the project. The video system was found useful for recording field survey plot.
1. Introduction
IUFRO ( international union of forestry organization) published the "international guideline for forest monitoring" in 1994. the basic forest types which have been used by FAO for the "Forest resources assessment (1990)" are introduced in the Guideline as the minimum requirement for global monitoring in order to contribute international activities in forestry community.
Based on the idea of this Guideline, we could classify forests into several types in Thailand. The main forest types in Thailand are evergreen forest, mixed forest and deciduous forest, and plantation and mangrove forest are found at specific areas. In northern Thailand, DDF (Dry Dipterocarp forest) are dominant in low altitude and evergreen trees are dominant at high altitude. MDF (Mixed Deciduous Forest) stands at the transitional one of these two forest types. Phonological changes of forests dcorrespond to the rainfall and the components of forest (forest stand condition) and it is clearly observed in DDF and MDF stands.
Satellite remote sensing technology are considered effective for monitoring these phonological aspects. The periodicity of observation is one of the main important characteristics of Satellite remote sensing. NOAA, Landsat, Spot, Mos and JERS are main satellites from which we can get earth observation images regularly.
The remote sensing community has used Normalized Difference Vegetation index (NDVI) of NOAA AVHRR data to monitor global vegetation conditions (Goward et al. 1991; Spanner et al. 1990; Tucker and choudhury 1987)). The index is sensitive to the quantity of active photosynthesizing biomass on the landscape (Burgan and Hartford 1993). Geographers have used NDVI data to develop a map that portrays vegetation patterns across the United States (Loveland et al. 1991).
This study aims to find and develop practical methodology on digital processing of satellite remote sensing data and other geographical information for observing and monitoring seasonal changes of tropical forest, which correspond to forest stand conditions.
Chiang Mai district were selected for this study. Forest development by shifting cultivation is widely being executed in Chiang Mai and multi-temporal TM data are considered useful to classify the forest, which correspond to forest stand conditions.
2. Methodollogy
(1) NDVI images of Landsat TM
The Landsat series polar-orbiting satellites with TM (thematic Mapper) sensor and other satellite, such as SPOT and MOS, provide frequent observations of Earth's surface. These remote sensing data have been received at the ground receiving station since 1986 in Thailand.
The NDVI is the deference of near-infrared and visible red reflectance values normalized over total reflectance of the two channels.
| NDVI= | Near_IR (TM. Channel 4)-Red (TM.
Channel_3) -------------------------------------------------------------------- Near_IR (TM, Channel 4)+Red(TM. Channel_3) |
This equation Produces NDVI values in the ranges of -1.0 to 1.0, where negative values generally represent clouds, water and other non-vegetated surfaces, and positive values represent vegetated surfaces, The NDVI relates to photosynthetic activity of living plants. The higher the NDVI value, the more "green" tge cover type (Deering et al.), That is , the NDVI increases as the quantity of green biomass increases (Burgan and Hartford, 1993).
To interpret the NDVI values for field use, we have devised methods to convert the NDVI data into more easily understandable representations of vegetation greenness as is used for AVHRR (Burgan and Hartford, 19930. These are called "Visual greenness" and "relative greenness".
Visual greenness (VG) indicates how green each pixel is in relation to a standard reference such as a highly green and densely vegetated evergreen forest. It is calculated as:
Where
NDV = observed NDVI value, V_dens=NDVE value of densely Vegetated evergreen forest.
An image is produced that portrays vegetation greenness as we would expect to see it if we were flying over the landscape. In this context, normally deforiaged,sparsely vegetated area will look cured compared to fully vegetated area such as the evergreen forest.
Because the visual greenness image may indicate rather limited changes over time, a second measure of vegetation greenness is expresses how green each pixel currently is in relation to the range of greenness observations for that pixel among the data collected. It is calculated as:
Where
NDV=observed NDVI value
ND_min =minimum NDVIvalue observed historically for that Pixel
ND_max=maximum NDVI value observed historically for that pixel
Historical maximum and minimum NDVI maps for the study area are necessary to be produced by searching all the TM NDVI values of collected data and saving the largest and smallest values observed for each pixel. Pixels affected by clouds and noises are excluded. These NDVI values are then composed into maximum and minimum maps and used with current NDVI maps to perform the visual and the relative greenness calculations.
(2) Forest Type Classification and shifting cultivation in chiang Mai
Typical forest types are tropical seasonal forests in chiang Mai province. The highest mountain in Thailand, Doi Intanon, is located at the west side of the study site. Four Landsat TM data of the same dry season, 31 Dec. 1990, 17 FEB. 1991, 5 March 1991 and 21March 1991 (path-Row: 131-47), were selected and geometrically corrected to be overlaid with each other using several ground control points obtained on UTM maps.
The forest type classification was executed using the normalized differential vegetation index (NDVI) images derived from the four Landsat TM data by the following formula.
Where
TM4 and TM3 indicate the channel 3 and the channel 4 of Landsat TM, respectively.
The steps of the analysis are as follows;
- the minimum value is subtracted from each channel data separately to value is subtracted from each channel data separately to reduced atmospheric effect before calculating the NDVI.
- The clustering analysis is applied to make forest cover map based on the NDVIs. The NDVI values are considered to be correspond to terrestrial (forest) condition and vegetation cover types in each image
- After the clustering , the vegetation type of each cluster is checked with existing vegetation maps , aerial photography and ground survey .
- digital elevation data are also collected by digitizing a present map and overland on TM data to analyze the correlation between the classification result and elevation that indicates some environmental condition , especially , such as temperature and water availability to vegetation .
(3) Field check system
Field checks were conducted to compared the results of clustering analysis and to check changes of forest types according to the elevation and shifting cultivation activities and land conditions in forest area.
Especially , the relations between forest types and terrestrial condition was the one of the main concerns in chiang mai study area . We compared the classification maps derived from the clustering method using satellite NDVI images with elevation and slope direction data.
A GPS (Global Positioning System ), a Polaroid camera , a video camera with fisheye lens , a rotator system for the video camera , a video camera with fisheye lens , a rotator system for the video camera and a field note were used for the field survey.
3. Result
(1) Forest type mapping
Four sequential LANDSAT TM images of a dry season , from December 1990 to February 1991 , were used . Then NDVI images were created by these satellite data (fig .1 ) on which radiometric corrections have been performed as explained before .A classification map was created based on the changes of these NVI values and the clustering method. As a result, sixteen clusters were generated and were merged into six vegetation classes that correspond to deciduous forest , two mixed forests evergreen forest , upland agricultural land and paddy field .
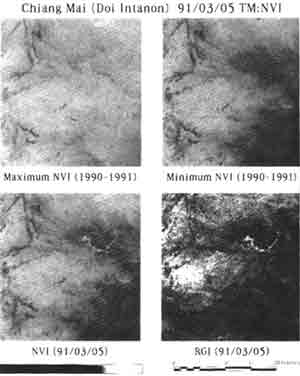
Figure 1. Image set for calculating Relative Greenness
Comparing this result with elevation data , the shifting zone between evergreen forest and deciduous forests was clearly appeared. Evergreen forests dominate below 700 m sea level .
By the satellite image interpretation , it was easily identified that the shifting cultivation was carried out only in ever green forest area , which are dominant upland area , which are dominant upland area in Chiang Mail .
(2) Field check system
Original image and classification map were printed with the scale of 1 / 50 , 000. road and terrain condition were checked based on the
Topographic maps with the same scale . using these information, field check points were selected beforehand and the field survey was executed at the each selected point.
The procedure at the field was as follows;
- get position with GPS
- note the position on video and the field note
- note the direction on Polaroid
- rotate the video camera with 180 degrees or 360 degree
- note on the field note (an example is shown in Figure 5)
- In forest : put the video upward with fisheye lens and keep walking slowly along a straight line for more than 10 meters.
although, the classification result clearly delineates evergreen forests, deciduous forests and paddy fields using the TM NDVI data, image interpretation technique was needed for separating agricultural lands from mixed forests. The shifting zone between evergreen forests and deciduous forests in 700 m and 800m is checked by the field survey, which support the analysis method using remote sensing data. Other researchers who checked on the ground at the same area, chiang Mai province, reported almost the same information ( Miyawaki, 1989).
The field surveys were successfully executed by the help of counterparts,. We found that the video system is useful. One of the problems is that the NTSC system is used in Japan and PAL system is used in Thailand. Although we have some problems on using the video systems, the system is very convenient and easy to handle. Measuring the crown density on video system will be developed in the laboratory almost as same as on a photo prints.
5.Reference
- Burgan, R. E. and R.. A Hartford, 1993, monitoring vegetation Greenness with satellite Data USDA Forest Service 14p
- (2) Deering, D.W. J.W Rouse, R. H. Haas, J.A. Schall, 1975, Measuring foriage production of grazing units from Landsat MSS, Proceedings of 10th international symposium on Rmote sensing of the Environment, ERIM, 1169-1174
- Goward, S.N., B. Markham, D.G. Dye, W. Dulaney, J. yang, 1990, Normalized difference vegetation index measurements from the advanced very high resolution radiometer , Remote sensing of the Environment, 35:257-277
- Loveland, T.R., J.W. Merchant, D.O. Ohlen, J.F.Brown, 1991, Development of land -cover characteristics database for the conterminous U.S., Photogram-metric Engineering and Remote sensing,57(11):1453-1463
- Miyawaki, A., 1989, Vegetation and agriculture in south-East Asia, pp.31-55, Diversity of Tropical Forest.
- Spanner, M.A, L/L/ Pierce, S.W. Running, D.L. Peterson, 1990, The seasonality of AVHARR data of temperate coniferous forests : relationship with leaf area index, Remote sensing of the Environment ,relationship with leaf area index, Remote sensing of the Environment, 33:97-112
- Tucker C.J. and B. Choudhury, 1987, satellite remote sensing of drought conditions. Remote sensing of the Environment, 23:243-251