| GISdevelopment.net ---> AARS ---> ACRS 1994 ---> Water Resources |
The Evaluation of Coherent
Scatterng in Rain Radar
Jiro Aoyagi and Nobuhiko Kodaira
Remote Sensing Technology Centre of Japan
Uni Roppongi BLDG 7-15-17, Roppongi
Miato-ku, Tokyo 106 Japan
Jiro Aoyagi and Nobuhiko Kodaira
Remote Sensing Technology Centre of Japan
Uni Roppongi BLDG 7-15-17, Roppongi
Miato-ku, Tokyo 106 Japan
1. Introduction
The main characteristic of rain radar is to be able to measure rainfall intensity quantitatively. The radar equation (6) is used to extract the rainfall intensity from the radar received power. However, there exists one problem in which the rainfall intensity is underestimated by several dB comparing with the actual ground rainfall intensity. Therefore, it is usual to introduce a corection factor to the radar equation so as to reproduce the actual rainfall intensity.
In order to improve such a situation, the authors proposed to introduce the idea of cohererft se\cattering for the mechanism of rain scattering 1 . The idea of the mechanism has been previously confined to incoherent scattering. Incoherent scattering is applicable to the reflection mechanism among the different frequency components by which the Doppler spectrum of the rain echoes is consisted of. However, the authors pointed out that the mechanism of coherent scattering had been overlooked so far, which is never avoidable to describe the interaction among the received amplitudes due to many rain drops contributing to the same frequnecy component.
We reported that the power ratio of coherent scattering to incoherent scattering is 3.6 dB for Marshall-Palmer rain dropsize distribution, which is given as an exponential distribution, which is given as an exponential distribution. And its Z-R relation is 296R. where Z is radar reflectivity where Z is radar reflectivity factor and R is rainfall intensity. It was found that the falue of 3.6 dB acts so as to correct the discrepancy between the radar equation and the rain fall measuremnts.
This paper will make it clear the power ratio more systemstically with the uses of the model distributions and unified series of random numbers. Furthermore. It will be emphasized that the power ratio varies with the rainfall intensity, because the rain drop size distribution based on Webull function 7 is introduced.
This study was carried out as one of the improvement of the accuracy of the rainfall measure ment by the rain radar installed on TRMM (Tropical Rainfall Measuring Mission Satellite which will be launched in August 1997.
2. Data Processing
The radar received poswer due to incoherent scattering is given by the arithmetic sum of the power caused by each rain drop. Such mechanism is valid to deal with the power due to the amplitudes between the different Doppler freqency components. Meanwhile, since the power for coherent scattering is dealed with the amplitudes caued by the rain drops in the same frequency component, the resultant power is affeted due to the relative positioning of the rain drops in space expressed in terms of the phase.
Therefore, in this study, the non-uniform distribution of rain-drops in the phase domain is reproduced using random numbers. Action 32 phase elements are used, on which rain-drops condisting of various sizes are randomly arragned in the number of 4096 as mentioned below. Then the residual amplitude as the result of the vector sum of each amplitude among those phase elements will contribute to the power which is called coherent scattering.
It is already known frm our study that it is not enough to increase only the number of random numbers which correspond to that of rain drops on the phase elements to get the reliable value of the power fatio. If there is a number (m.n) of the random numbers, the values of the power ratio calculated using the number, n. are fluctuating each other. So. By repeating such a calculation for m times using different series of random numbers, we can get fmuch reliable result from the averaged data of m power ratio values, This scheme is similar to that of the averaging of the fluctuating amplitudes of rain echoes in order to get the radar mean received power.
In our calculations, 4096 was chosen for the number, n, and 256 for m by taking account of the ability of the computer used . In this case, the calculation time is beyond 2 hours. If the number becomes twice like 2 n and the number m is fixed then the calculation time will increase by four times.
3. Model Distributions
We assumed that the factor contributing to the power ratio is caused only by the rain drop-size distribution in space (2) Therefore, it will be studied in this section that how much the power rations will vary by various types of model dropare shown in Table 1 The model distributions used here are six types such as are of quadrant, exponential mode, right-half Gaussian mode, right-angled triantle, quadrant and rectangle which are monotonously decreasing functioons except the rectangle.
Table 1 : The relationship between the statistical index and
the power ratio of coherent scattering to incoherent scattering for six
model drop size distributions.
The value 0.01 was chosen for the increment , dx, of x shown in the row of the exponential distribution of the table. From the viewpoint of the limited number 4096 . if one trys to make it narrower the increment more. There is a risk not to be able to reproduce rightly the original distribution.
As shown in Table 1. Each model distribution has its inherent value of the statisticalindex given by the ratio of the standard deviation to the mean value or the square root of the effetive value, and the corresponding value of the power ratio.
In Figure 1. The relations between the power rations and the indexes for six model distributions are shown by blank dots. And it is quite interesting to see from the figure that the values of the power ratio can be expressed by a quadratic equation as a function of the statistical indexes. Therefore, if the statistical index or the form of the rain drop size distribution is assumed, the values of the power ratio cab be estimated or in reverse.
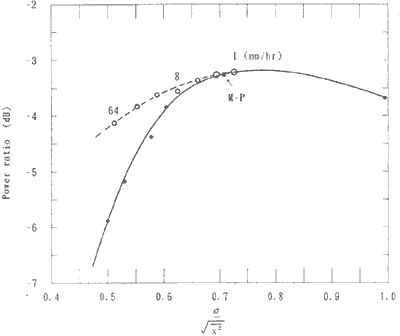
Figure 1 The Relationships of the power ratio of coherent scattering to incoherent scattering to the statistical index. Black points show the model distributions. Circles show Weibull distributions.
For instance, if the rain drop-size distribution in given by the exponential mod, the power ratio will be given as 3.3l dB. It is also known that the maximum value of the power ratio is never beyond 3.1 dB Meanwhile, if the rain drop size distribution so as to yield the values below the statistical index for the quadrant model do not exist actually, the power rations less than about -5 dB will never occur in the radar rainfallmeasurement . It is necessary to take notice that the model distributions are monotonously decreasing functions in this case.
4. Rain Drop Size Distributions
4.1 Exponential Distribution
At the last conference (1) the power ratio of Marshall - Palmer's rain drop size distribution 5 was presented. The M-P distribution, which is given by an exponential pattern having a simple from is used widdely in the field of f\radar meteorology, In the exponential distribution (3) the number of rain drop N (D) is given by
N (D) N o exp (A D) (1)
where D is drop diameter, N (D) dD is the number of drops of diameter between D and D +dD per unit volume of space, N is the value of N (D) for D = 0 and A = AR a where R is rainfall intensity, A is 41 ad a is 0.21 for M-P distribution.
By integrating Eq. (1) in regard to rain drops from zero to infinite, the total number N of the drops per unit volume is given as
N = N o / A (2)
The total number N changes as a function of N and A However, it is necessary to take notice that the total number of drops will be actually accountedin the volume or space in which the rain drops contributing to the amplitudes of the same frequency component exist rather chan that of per unit volume. WhEN tHE RAINFALLIS OBSERVED BY RADAR> BY THIS REASON> The tatal number of the rain drops used in simulation was fixed to 4096 which corresponds to those of the model distributions discussed in Section 3.
Based on this fact, the comparison of the power ratio between M-P distribution and the model distributions can be made in the same criteria, A plot of M-P distribution is shown by an arrow in Figure 1, which is also that of the model exponential disstribution.
Many scientists use also the exponential distribution to obtain their own rain dropsize distributions by ehanging the parameters N and A (for example. Imai et, al (4)) However as discussed in te foregoing section, if the rain dropsize distribution is givben by the exponential mode the resultant values of the power ratio will be always given by 3.3 dB regardless of rain types or the rainfall intensities in either case, because the statistical index of the exponential distribution gives only one value in spite of any values of the parameter. A
4.2 Weibull Distribution
There are many investigations as for the rain drop -size distribution, though Marshall Palmer's distribution is one of the most famous models, In this section, the power rations due to the drop -size distribution expressed by Weibull function which is more likely applicable for thundershowers bringing the internse rainfall intensity was investigated. The number of drops is given by Sekine (7) as follows:
N(D) = No C\D (D\b) c-1 exp(-(D\b)c) (3)
where
N o = 0.001 cm-3
c = 0.95R0.14
b = 0.26R0.42
The characteristic of this nodel is that the form of the distribution varies with the rainfall intensity R, since the factor c is a function of R. instance, ifR is 1 mm/r. the sttistical index (a / root) statisical index (a /root of) the effective value. 0.725 Is slightly larger than that or the exponential mode. If R is mm/hr. The index is 0.552 whter is positioned in between the right angled triangle and quadrant mode. And if R is mm hr htee index is 0.51 which is below that of the quadrant mode .
The values of the power ratio by welbull distribution are alse shown by circles in Figure is The abscissa is commonly given the statistical idex. The cresponding rainfall intenstties are 1.2.4.8, 16 32 and 64 mm/hr . Only the numbers of 1,8 and 64 mm/hr are dedicated near the circles. Furthermore z-R relation of Weibull function is given by Z=286 R (7)
According to the increase of rainfall intensity level, the corresponding value of the power ratio decreases from 3.2 dB are R = 1mm/hr because of the patter variation inherent to Weibull function. It is important take notice here that the patterns of Weibulll distributie in the intense rainfall intensit level tends to be a sinbgle pea distribution having a maximum value of the number of rain dro in larger drop sizes but not the drop diameter D =0 Accorde ingly, the discrepancy of the power ratio between Weibul distributions and the mode distri butions are expressed by the monotonusly decreasing function.
5. Conclusions
In order to make it clear the power ratio of conherent scattering to incoherent scattering six types of model distributions are investigated to compare with Marshall Palmer drop size distri bution and Weibull distribution used in the field of radar meteorology. Then it was found that each mode of the distribution has the respective inherent statistical index giviven by the ratio of standard deviation to mean value or the squre root of the efective value, and the values of those power ratios are clearly given as a function of the indexes of the distributions. In the case of the exponential distribution which is used for the M-P rain drop size distribution the power ratio is 3.3 dB which is almost the maximum value expected by the monotonusly decreasing function.
On the other hand, in the case of Weibull distribution which was proposed as more realistic rain drop size distribution 7 the index varies with the rainfall intensity. In the case of weaker rainfall intensity such as 1 mm/hr, the index is nearly equal to that of the exponential distribution. According to the increase of the rainfall intensity. The distribution tends to be a single peaked one which has the maximum number of rain drops in larger drop-size regions but not D=0 The power ratio varies from 3.2 dB at 1mm/hr to 4.1 dB at 64 mm/hr.
Accordingly, if Weibull distribution is valid more for representating the actual rain drop size distribution, 4 dB of the power ratio are especially taken into account for the brought by unumaelsiofms Finally, it was found that the ambiguity of about 1 dB of the power ratio have to be considered depending on the rainfall intensity. In another word it can be said that 3.6 dB of the mean power ratio is expected with the deviation of 0.5 dB in the rainfall measurement by radar.
References
The main characteristic of rain radar is to be able to measure rainfall intensity quantitatively. The radar equation (6) is used to extract the rainfall intensity from the radar received power. However, there exists one problem in which the rainfall intensity is underestimated by several dB comparing with the actual ground rainfall intensity. Therefore, it is usual to introduce a corection factor to the radar equation so as to reproduce the actual rainfall intensity.
In order to improve such a situation, the authors proposed to introduce the idea of cohererft se\cattering for the mechanism of rain scattering 1 . The idea of the mechanism has been previously confined to incoherent scattering. Incoherent scattering is applicable to the reflection mechanism among the different frequency components by which the Doppler spectrum of the rain echoes is consisted of. However, the authors pointed out that the mechanism of coherent scattering had been overlooked so far, which is never avoidable to describe the interaction among the received amplitudes due to many rain drops contributing to the same frequnecy component.
We reported that the power ratio of coherent scattering to incoherent scattering is 3.6 dB for Marshall-Palmer rain dropsize distribution, which is given as an exponential distribution, which is given as an exponential distribution. And its Z-R relation is 296R. where Z is radar reflectivity where Z is radar reflectivity factor and R is rainfall intensity. It was found that the falue of 3.6 dB acts so as to correct the discrepancy between the radar equation and the rain fall measuremnts.
This paper will make it clear the power ratio more systemstically with the uses of the model distributions and unified series of random numbers. Furthermore. It will be emphasized that the power ratio varies with the rainfall intensity, because the rain drop size distribution based on Webull function 7 is introduced.
This study was carried out as one of the improvement of the accuracy of the rainfall measure ment by the rain radar installed on TRMM (Tropical Rainfall Measuring Mission Satellite which will be launched in August 1997.
2. Data Processing
The radar received poswer due to incoherent scattering is given by the arithmetic sum of the power caused by each rain drop. Such mechanism is valid to deal with the power due to the amplitudes between the different Doppler freqency components. Meanwhile, since the power for coherent scattering is dealed with the amplitudes caued by the rain drops in the same frequency component, the resultant power is affeted due to the relative positioning of the rain drops in space expressed in terms of the phase.
Therefore, in this study, the non-uniform distribution of rain-drops in the phase domain is reproduced using random numbers. Action 32 phase elements are used, on which rain-drops condisting of various sizes are randomly arragned in the number of 4096 as mentioned below. Then the residual amplitude as the result of the vector sum of each amplitude among those phase elements will contribute to the power which is called coherent scattering.
It is already known frm our study that it is not enough to increase only the number of random numbers which correspond to that of rain drops on the phase elements to get the reliable value of the power fatio. If there is a number (m.n) of the random numbers, the values of the power ratio calculated using the number, n. are fluctuating each other. So. By repeating such a calculation for m times using different series of random numbers, we can get fmuch reliable result from the averaged data of m power ratio values, This scheme is similar to that of the averaging of the fluctuating amplitudes of rain echoes in order to get the radar mean received power.
In our calculations, 4096 was chosen for the number, n, and 256 for m by taking account of the ability of the computer used . In this case, the calculation time is beyond 2 hours. If the number becomes twice like 2 n and the number m is fixed then the calculation time will increase by four times.
3. Model Distributions
We assumed that the factor contributing to the power ratio is caused only by the rain drop-size distribution in space (2) Therefore, it will be studied in this section that how much the power rations will vary by various types of model dropare shown in Table 1 The model distributions used here are six types such as are of quadrant, exponential mode, right-half Gaussian mode, right-angled triantle, quadrant and rectangle which are monotonously decreasing functioons except the rectangle.
| No | Mode | Graph | s/x |  |
Power ratio (dB) |
| 1 | Arc of quadrant |  |
7.717 | 0.992 | - 3.7 |
| 2 | Exponential dist (N(x) = N0 exp (-x) |  |
1.0 | 0.707 | -3.3 |
| 3 | Right half Gaussian dist |  |
0.756 | 0.603 | -3.8 |
| 4 | Right angles triangle |  |
0.707 | 0.577 | -4.4 |
| 5 | Quadrant |  |
0.623 | 0.528 | -5.2 |
| 6 | Rectangle |  |
0.577 | 0.5 | -5.9 |
The value 0.01 was chosen for the increment , dx, of x shown in the row of the exponential distribution of the table. From the viewpoint of the limited number 4096 . if one trys to make it narrower the increment more. There is a risk not to be able to reproduce rightly the original distribution.
As shown in Table 1. Each model distribution has its inherent value of the statisticalindex given by the ratio of the standard deviation to the mean value or the square root of the effetive value, and the corresponding value of the power ratio.
In Figure 1. The relations between the power rations and the indexes for six model distributions are shown by blank dots. And it is quite interesting to see from the figure that the values of the power ratio can be expressed by a quadratic equation as a function of the statistical indexes. Therefore, if the statistical index or the form of the rain drop size distribution is assumed, the values of the power ratio cab be estimated or in reverse.
Figure 1 The Relationships of the power ratio of coherent scattering to incoherent scattering to the statistical index. Black points show the model distributions. Circles show Weibull distributions.
For instance, if the rain drop-size distribution in given by the exponential mod, the power ratio will be given as 3.3l dB. It is also known that the maximum value of the power ratio is never beyond 3.1 dB Meanwhile, if the rain drop size distribution so as to yield the values below the statistical index for the quadrant model do not exist actually, the power rations less than about -5 dB will never occur in the radar rainfallmeasurement . It is necessary to take notice that the model distributions are monotonously decreasing functions in this case.
4. Rain Drop Size Distributions
4.1 Exponential Distribution
At the last conference (1) the power ratio of Marshall - Palmer's rain drop size distribution 5 was presented. The M-P distribution, which is given by an exponential pattern having a simple from is used widdely in the field of f\radar meteorology, In the exponential distribution (3) the number of rain drop N (D) is given by
where D is drop diameter, N (D) dD is the number of drops of diameter between D and D +dD per unit volume of space, N is the value of N (D) for D = 0 and A = AR a where R is rainfall intensity, A is 41 ad a is 0.21 for M-P distribution.
By integrating Eq. (1) in regard to rain drops from zero to infinite, the total number N of the drops per unit volume is given as
The total number N changes as a function of N and A However, it is necessary to take notice that the total number of drops will be actually accountedin the volume or space in which the rain drops contributing to the amplitudes of the same frequency component exist rather chan that of per unit volume. WhEN tHE RAINFALLIS OBSERVED BY RADAR> BY THIS REASON> The tatal number of the rain drops used in simulation was fixed to 4096 which corresponds to those of the model distributions discussed in Section 3.
Based on this fact, the comparison of the power ratio between M-P distribution and the model distributions can be made in the same criteria, A plot of M-P distribution is shown by an arrow in Figure 1, which is also that of the model exponential disstribution.
Many scientists use also the exponential distribution to obtain their own rain dropsize distributions by ehanging the parameters N and A (for example. Imai et, al (4)) However as discussed in te foregoing section, if the rain dropsize distribution is givben by the exponential mode the resultant values of the power ratio will be always given by 3.3 dB regardless of rain types or the rainfall intensities in either case, because the statistical index of the exponential distribution gives only one value in spite of any values of the parameter. A
4.2 Weibull Distribution
There are many investigations as for the rain drop -size distribution, though Marshall Palmer's distribution is one of the most famous models, In this section, the power rations due to the drop -size distribution expressed by Weibull function which is more likely applicable for thundershowers bringing the internse rainfall intensity was investigated. The number of drops is given by Sekine (7) as follows:
where
N o = 0.001 cm-3
c = 0.95R0.14
b = 0.26R0.42
The characteristic of this nodel is that the form of the distribution varies with the rainfall intensity R, since the factor c is a function of R. instance, ifR is 1 mm/r. the sttistical index (a / root) statisical index (a /root of) the effective value. 0.725 Is slightly larger than that or the exponential mode. If R is mm/hr. The index is 0.552 whter is positioned in between the right angled triangle and quadrant mode. And if R is mm hr htee index is 0.51 which is below that of the quadrant mode .
The values of the power ratio by welbull distribution are alse shown by circles in Figure is The abscissa is commonly given the statistical idex. The cresponding rainfall intenstties are 1.2.4.8, 16 32 and 64 mm/hr . Only the numbers of 1,8 and 64 mm/hr are dedicated near the circles. Furthermore z-R relation of Weibull function is given by Z=286 R (7)
According to the increase of rainfall intensity level, the corresponding value of the power ratio decreases from 3.2 dB are R = 1mm/hr because of the patter variation inherent to Weibull function. It is important take notice here that the patterns of Weibulll distributie in the intense rainfall intensit level tends to be a sinbgle pea distribution having a maximum value of the number of rain dro in larger drop sizes but not the drop diameter D =0 Accorde ingly, the discrepancy of the power ratio between Weibul distributions and the mode distri butions are expressed by the monotonusly decreasing function.
5. Conclusions
In order to make it clear the power ratio of conherent scattering to incoherent scattering six types of model distributions are investigated to compare with Marshall Palmer drop size distri bution and Weibull distribution used in the field of radar meteorology. Then it was found that each mode of the distribution has the respective inherent statistical index giviven by the ratio of standard deviation to mean value or the squre root of the efective value, and the values of those power ratios are clearly given as a function of the indexes of the distributions. In the case of the exponential distribution which is used for the M-P rain drop size distribution the power ratio is 3.3 dB which is almost the maximum value expected by the monotonusly decreasing function.
On the other hand, in the case of Weibull distribution which was proposed as more realistic rain drop size distribution 7 the index varies with the rainfall intensity. In the case of weaker rainfall intensity such as 1 mm/hr, the index is nearly equal to that of the exponential distribution. According to the increase of the rainfall intensity. The distribution tends to be a single peaked one which has the maximum number of rain drops in larger drop-size regions but not D=0 The power ratio varies from 3.2 dB at 1mm/hr to 4.1 dB at 64 mm/hr.
Accordingly, if Weibull distribution is valid more for representating the actual rain drop size distribution, 4 dB of the power ratio are especially taken into account for the brought by unumaelsiofms Finally, it was found that the ambiguity of about 1 dB of the power ratio have to be considered depending on the rainfall intensity. In another word it can be said that 3.6 dB of the mean power ratio is expected with the deviation of 0.5 dB in the rainfall measurement by radar.
References
- j. Aoyagi and N. Kodaira, 1993. On the reflection mechanism of weather radar echoes. Proc of 14th Asian Conf. On Remote Sensing. Oct. Teheran. B -5-1-B-5-6
- J. Aoyagi and N Kodaira, 1994 Reflection mechanism of precipitation echoes. (in Japanese). Proc. Of 16th Japanese Conf. On Remote Sensing, May Tokyo, 49-52
- D. Atlas, 1964 : Advances in radar meteorology Adv Geophys 10 Academic Press, 317-478.
- I Imai M. Fujiwara, I Ichimura and Z. Yoshihara, 1955: Radar reflectivity and the drop size distributuon of rain J. Meteorao Tokyo 7 (7) 422-433.
- J. S. Marshall and W. M. K. Palmer 1948: The distribution of raindrops with size, J Meteor. 5, 165-166
- J. R. probert Jones, 1962j: The radar equation in meteorology, Quat J. Roy. Meteor Soc. 88, 485-495.
- M. Sekine, 1986: The relationship tween radar reflectivity and rainfall rate. The Transactions of the IECE of Japan, Vo1. E 69. No. 5, 581.