| GISdevelopment.net ---> AARS ---> ACRS 1994 ---> Water Resources |
Estimation of basin Snow
water equivalent (SWE) using accumulation and depletion patterns of
Snowcover from optical satellite Data
P. Reuben Paul1,
Ch. L. V. Ramana roa1, E. Siva Sankar
1
1 Engineers, Water Resources Group,
National Remote Sensing Agency
Dept. of Space, Hyderabad 500037
Abstract1 Engineers, Water Resources Group,
National Remote Sensing Agency
Dept. of Space, Hyderabad 500037
Basin Snow Water Equivalent (SWE) which is an indicator of the amount of water stored in the snowpack, is one of the most important variables in forecasting snowmelt runoffs. However , no direct measurements of snow water equivalent are made in most of the Himalayan basins due to various reasons. Very often only snowfall measurements at a few unrepresentative snow gauges located in valleys are the only data available. Indices for SWE can still be derived from the snowfall and temperature data dnd used in snowmelt runoff modelling as in the case of Sutlej basin. However, this grund measured snowfall and temperature data are not available at the time of forecasting snowmelt rumoffs due to inaccessibility of the terrain.
A method to estimate basin SWE Index has been developed using Accumulation and Depletion Paterns data. These estimates are being use in operational forecasting of 3 month (Apr-May_Jun) snomelt runoffs at Bhakra dam on Sutlej river. This method is based on the fact that a thick snowpack starts depleting late and depletes slower compared to a thin snowpack which starts depletin early and also depletes faster. The accumulation and depletion curves which are constructed by using areal extent of snowcover on different dates spread over the entire snowmelt season reveal this information on the SWE. The set of curves for the past many years are analysed and the SCA as on 1st April, rate of depletion (slope of the curve) and an index of the onset of the depletion (indicating early, normal or late setting-in of the depletion) is related to snow water Equivalent Index computed from ground measured snowfall at 20 stations in the Sutlej basin.
In any forecast year, by monitoring snow cover during late accumulation and early depletion period and by using the above relationship, the basin SWE Index can be estimated and used for forecasting snowmelt runoff. The results of the simulations are presented and discussed.
Engineers, Water Resources Group, National Remote Sensing Agency, Dept. of Space, Hyderabad 5000 037.
1.0 Introduction:
Snowmelt runoff modelling and forecasting in mountainous basins requires a lot of information of the snowpack, meteorology, hydrology, and terrain Very often, such information is not available in the large data sparse basin of the Himalayas. Remote sensing remains the most important means of obtaining some information on the snowpack. One of the most easily obtainable information which is used in runoff modelling is the Snow Covered Area, and can be very efficiently mapped and monitored using various spatial, spectral and temporal rssolution satellite data depending on the size of the basin and the availability of such data.
In the model developed for Sutlej basin to forecast long-term (3 month) summer inflows into the Bahakra reservoir, Snow Covered Area (SCA), an Index of the volume of water stored in the snowpack (Snow water Equivalent Index) and an Index of the Energy input to the Snowpack (Accumulated Degree Days Index) have been used.
A new method of estimating the Index of the volume of water stored in the snowwpack (SWE Index) using accumulation and depletion patterns of snow cover derived from optical remote sensing data has been developed and is being used in operational long-term snowmelt runoff forecasts in the Sutlej basin.
2.0 Description of The Basin:
The Sutlej river which originates near the Manasarovar lake in Tibet, cuts across the Himalayas and flows into India. The basin upto the Bhakra Dam is about 50,000sq. Kms in extent and is highly heterogenous in terms of climatology, terrain, snow acumulation and land cover The Tibetian portion of the basin is arid with less amount of precipitation, Whereas, the Spiti and other portions of the basin receive considerable amount of precipitation. It is interesting to note that above a certain contour there is absolutely no rainfall even during the south West monsoon. In addition, the Tibetian portion of the basin to a large extent, is relatively very flat, thereby draatically affecting the snow covered areas even with small amounts of snow percipitation.
3.0 Snow Water Equivalent and Its Significance:
Snow water Equivalent (SWE) at any point in the basin is expressed as standing column of water resulting from the melting of a snow sample of a unit cross section and height equal to the depth of the snowpack at the point of measurement. Conventionally, SWE measurements. At a number of points in the basin are made in order to get an overall idea of the water contained in the snowpack in the basin on any particular day. Usually these measurements are made by snowpit method or using instruments like Snow pillows etc. In the case of Sutlej basin -as is the case in most of the Himalayan basins - no regular snow surveys are conducted for in - situ measurements of SWE, However, the Bhakra Beas Management Board (BBMB) has established about 21 snow gauges in the Indian portion of the basin to measure daily snowfall (1)
Therefore, this valuable ground data on daily snowfall in Sutlej basin, is being used to compute an Index of the Water Equivalent of the entire basin (SWE Iindex) by cumulating the Snowfall at all the 21 snow guages over the ntire accumulation season after certain corrections are made (2,3) Even though these stations are distributed only in the Indian portion of the basin and are also located at relatively low elevations. The SWE Index computed from these measurements still explains considerable amount of yearly variability of snow accumulation as is seen in the relationshi with the Apre -May-Jun discharges (fig. 1)
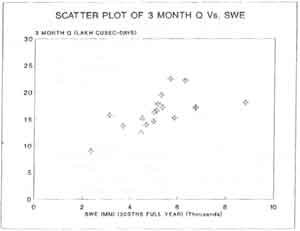
Figure 1 SWE index computed from daily snowfall data Vs. 3-month (April-May-June) discharges showing a significant correlation.
This Index computed from ground data is used for snowmelt runoff model simulations and validation. However, the ground measured snowfall is not received from the field till about the middle of May, due to inaccesssibility of terrain, Therefore , computing the bdex of SWE from ground data in not possible when the initial Forecast of snowmelt runoffs is given in the 1st week of April every Year.
The new method accummulation and depletion period using remote sensing is based on the premises that a thin snowpack ( low SWE ) starts depleting early and also depleting faster compared toa thick snowpack ( high SWE ) which starts depleting late and also depletes slower ( Fig. 2)
Figure 2 The hypothetical relationship between SWE Index and the depletion of snow cover.
4.0 Estimation of SWE index from Accumulaton and depletion curves :
Accumulation and Depletion curve for any given year is a graphical representation depicting the gradual increase and decreseas of the areal extent of snow cover in the basin due to winter snowpack buildup and summer ablation ( 4), . An Accumulation and Depletion curve is obtained by plotting % SCA on different dates ( during the period February to July ) Against time ( Fig. 3) . Tis % SCA is computed from the digital analysis of all relatively cloud free NOAA- AVHRR data during this period after appropriate geometrical corretion are made. Spectral bands I ( visible ) 3 ( mid IR ) and 4 ( thermal IR ) are used for this purpose . A 1 Km Resolution Digital Terrain Model ( DTM ) is used to extrapolate snow cover under clouds. A limited amount of Landsat MSS/ TM and IRS LISS I/ II data is used to verfy the AVHRR data analysis result since no real time ground verification is possible in snow applications. The percentage SCA statistics of different sub -basin and the entire basin are computed and are added to the already exiting data base.
Figure 3 Snow cover Depletion Curves of Sutlej basin. The initial position and pattern of each curve is indicative of the SWE.
In general , the depletion curve is the cummulative effict of the SWE in the basin the temperature regime , and the under lying terrain. . While developing these curves , care is to be taken to account for possible temporary increase in snow covered area due to snowfall just prior to the date of satellite overpass . Therefore , the contribution of such snowfall to the seasonal snowpack has to be assessed. This years relatively easier in the case of depletion curves for the past years since the hydro- meterological data ( daily snowfall , rainfall, temprature ) is readily available to aid the develoment of these curves. Region - wise depletion of snow cover is also studied to understand the regional distribution of new snowfall and its influence on the SCA of the entire basin which will assist in finalising the depletion curve of the entire basin . It is especially useful in forecast situation in the absence of ground data ( Fig. 4)
Figure 4 Spatial depletion curves of Sutlej basin for the year 1993, showing the differences in snow accumulation and depletion in differences portions of the basin.
As mentioned in the earlior paragraph, the temperature regime in the basin also affects the depletion of the snow cover , in addition to the the SWS of the basin , In order to study , modified depletion curves are drawn by replacing " Time" by " Accumulated Degree Days " along the X -axis . However, in the case of Sutleg Basin, It has been found that the general trend and relative position of the depletion cruves of the various years do not change compared to the original depletion curves. This may be attributed to the fact that during the initial depletion period , the temperatures in the basin are still quite low, and the differences in the curves are primarily due to the differences in the SWS of the basin.
The actual depletion curves of sutleg basin depleted in Figure in show that the trend of the curves is quite complex compared to the hypothetical curves in Figure 2. However, these curves still confirm the concept that the relative placement of
The curve ( upto the middle of April ) and its shape are indicators of the Snow water Equivalent Index of the entire basin resulting from the snowpack builup up to the end of the winter accumulation period ( end of March ) .
This observation can be reinforced by careful interpretion of the curves. Three typical Years 1987, 1990 and 1992 are explained as examples In the case of 1987 , the % SCA was quit low continuously . The slop of the curves was flatter compared to that of '92 but steeper compared to that of '90. The onset of the depletion was normal compared to '90 when the onset of depletion was delayed. In the case of '92 the % SCA started at a high of about 72% in the middle of March but the slop was considerably steeper compared to the other two years, The onset of depletion was however normal. In case of '90 % SCA was consistantly high and the slop was relatively quite low. The onset of depletion was also delayed. The combined effect of the % SCA as on 1st April , slop of the depletion curve between 20th March and 20th April and the onset of depletion can be taken as indicators of the SWE in any given Year. Therefore , the SWE of the year 1987 was lower compared to that in 1992, and the SWE in 1992 was lower compared to that in 1990 ( Fig.5)
Figure 5 Depletion Curves of 1987, 1990 @ 1992 having typical depletion patterns. Basic interpretation of the Curves using the indicative of SWE Index is also given.
5.0 Results of Simulation Studies and Discussion :
A Multi - linear regression relationship has been developed between SWE Index and the three variables a ) % SCA Index , b ) Rate of Depletion Index, c ) Depletion onset Index. The data set of the years 1976 to 1981 and 1987 to 1993 ( excluding 1988, 1989) have been used in the development of the equation. The Sy/x obtained is 140 mm. and the R2 is 0.93. The depletion curves of the years 1976 to '81 are based on the SCAobtained from visual analysis of satellite data and therefore have some inherent errors .The depletion curves of the years 1987 , 1990 to 1993 are based on diigital analysis. Ax the data of more number of years are analysed digitally, the visual analysis based depletion curves will be replaced to get a more homogenous data set. The simulation results for the years 1987 , 1990 to 1993 have been presented below to demonstrate the technique ( Table .1 )
The percentage error computed with respect to the actual SWE Index ( obtained from the ground measured snowfall) is quite low in most cases. However, the error in 1987 and 1992 is large, may be due to the fact that the relationship between SWE Index SCA and rate of depletion is not linear as was assumed.
Using the estimated Snow Water Equivalent Index in 1994, a long term ( 3 Month) Snowmelt runoff forecast of 15.0 lakh cause -days +- 10% error was issues in the 1st week of April , to Bhakra Beas Management Board ( BBMB) as the " Initial Forecast " This was followed by a " Revised Forecast" of 15.5. LAKH CUSE - DAYS -+ 5% error in the ent of May 1994 . The actual inflows into the Bhakra reservoir as mesured by BBMB was 16.3 lakh cusec - dyas , which means an error of -8% for Initial Forecast and - 5% for Revised Forecast ( 5) .
Table . 1 : The results of Simulation of SWE Index
| YEAR | % sca1 INDEX | SLOP2 INDEX | DEPL. ONSET3 INDEX | ACTUAL SWE INDEX | SIMULATED SWE INDEX | % error |
| 1987 | 52.0 | 0.617 | 2 | 4707 | 3705 | -21.0 |
| 1990 | 64.5 | 2.4 | 3 | 5500 | 5235 | -4.8 |
| 1991 | 62.0 | 3.0 | 3 | 5355 | 5610 | +4.8 |
| 1992 | 60.0 | 1.277 | 2 | 4344 | 4973 | +14.0 |
| 1993 | 52.0 | 2.5 | 1 | 3686 | 3825 | +3.7 |
| 1994 | 53.0 | 2.0 | 1 | 3762 | 3627 | +3.5 |
1. The % SCA as on 1st April interpolated from the depletion curve is taken SCA Index.
2. Slop of the depletion curve between 20th March and April is taken slop Index
3. The onset of the Delpletion in Sca observed from the depletion curve is as the onsert Index ( 1 = early onset, 2 - normal onset, 3 - late onset )
6.0 Conclusion :
A simple operational technique for computing the SWE Index from delpetion cureve obtained form analysis of optical satellite data has been developed for the firest time. This is being used for operational forecasting of snowmelt runoff in to Bhakra reservior when ground data is not available in time for forcasting . The reliability of the estimates of the SWE Index is expected to improve with more number of digital SCA based depletion curves being added to the data set. Better accounting for lossess during the accumulation season will also improve the relationship .
7.0 Acknowledgements:
The authors are highly greatful to Bhaskra Beas Management Board ( BBMB ) officials especially sri D.R. Luthra , Member ( irrigation ) Sri R.N. Aggarwal Director ( Regulations ) Sri. G. Dudwal , Executive Engineer and Sri Bhatla for their constent technical cooperation and support and data. Authors wouldlike to thank Dr. Chari Group Director , NRSA for his constant support and technical criticism .
References:
- "Anonymous" (1988) Snow Hydrology Studies in Sutlej and Beas Catchments - BBMB paper in the Proceedings of the Workshop on Snow Hydrology, Manali, India.
- Sevruk B. (1985a) Conversion of Snowfall Depths to Water Equivalents in the Swiss Alps, Workshop on the Correction of Precipitation Measurements, 1-3 April, Zurich.
- Sevruk B (1985b) Correction of Precipitation Measurements: Swiss Experience, Workkshop on the Corrrection of Precipitation Measurements, 1-3 April Zurich.
- Dorotyhy Hall K & Martinec J (1985) Remots Sensing of Snow and Ice, Chapman and Hall Publications.
- Reuben Paul P., et. Al, (1994) A New Appreoch in Operational Long Term Snowmelt Runoff Rorecasting in Sutlej Basin using Snowcover Depletion Patterns. To be presented at the International Symposium on Snow and Related manifestations, Manali, India (Sept. 26-28)