| GISdevelopment.net ---> AARS ---> ACRS 1994 ---> Water Resources |
Recession of Dead Sea Through
the Satellite Images
Eng. Omar Qudah, Eng.
Hussein Harahsheh
Royal Jordanian Geographic Centre
Amman-Jordan
1994
1-IntroductionRoyal Jordanian Geographic Centre
Amman-Jordan
1994
Surface water is one of the features most detectable by remote sensing. In a complementary way, it's special signature is as typical as that of vegetation because of itsgreat absorption of the spectrum. Therefore the location and delineation of water bodies. Is one of the most reliable operations that can be done by space imageries and multispectral data. The land/sea interface of shoreline systems can be mapped in all parts of the electromagnetic spectrum where significant gradients in the reflected or emitted energy are present.
Recently, and due to the decrease in the inflow into the Dead Sea, the sea component of the shoreline system undergoes very fast and dynamic changes. This paper represent a monitoring of this dynamic processes. Of environmental changes in the near shore region since 1947 using Satellite images.
2-Study area
The formaton of Dead Sea was known through the Plate Tectonics Theory, The Dead Sea is located in the Syrio-African Rift. It is composed of two pats, the northern and the southern pats which are separated by the Lisan Island. The catchmENT area is about 40,000 km2. The maintributary of the Dead Sea is the Jodrdan River Which drains the northern catchment a relatively rain-rich. The eastern and western catchments ar very small and hence, their contribution is small. The southern catchment, consisting of the northern part of wadi. Araba and its eastern and western highlands, is poor is precipitation and small in area so that its contribution is very minor. Figure (1) shows. Dead Sea basin with it' S main tributary rivers and wades.
Fig 1 Dead Sea Catchement Area
Measurements of the Dead Sea at the end of fifties are : length is around 80 l, and the greatest width is about 17.5 km. The surface area is about 1000 km2 of which about 757 km2 is located in the northern part and 240 km2 in the southern part . The salt pans did not exist at that time . The altitude at the surface is around 340 m. The deepest point is located in the northern part and is 400 m below the surface (Lynch 1852), while the southern part is shallow with greatest depth of only 10m.
These measurements are considered the origin state of the Dead Sea. The reason for such consideration is that on the average, the total inflows was somewhat equal to evaporation. The annual inflows of 1600 MCM/year are that of the Jordan river discharge (1200 MCM/Year) and of other wades and springs on both sides of sea (400 MCM/year). The annual evaporation is estimated at 1600 MCM/year. Hence a state of equilibrium was established.
However since the beginning of the sixtines, Jordan and Israel started a number of hydraulic projects in the basin. These projects resulted in a gradual decrease of the amount of discharge into the Dead See and hence in a gradual recession of the seea.
Since 1964, Israel drains aproximately 500 MCM/year from the Taberius lake to Israel territories, currently, this amount rose to 650 MCM/year, and so that no water flows downstream of the lake from the upper into the lower Jordan River, except during the wet years when the lake can not accommodate the total inflows. Moreover, the discharge of the yarmouk river into the Jordan river was around 400 MCM/year prior to the use of the water by the different riparian. In the past three centuries, this amount has gradually declined to very small discharges, only as a result of large floods which can not be accommodated by existing extraction facilities. Currently, Syria extracts 160-170, Jordan 100-110 and Israel around 100 MCM/year. In addition. Jordan started the construction of a number of dams of total capacities around 110 MCM, and Arab 20 MCM . And finally the other wades and springs on both side of the Dead Sea are dammed or captured by other constructions.
A study has been made in 1982, and presented in the First Conference on Geology in jordan, the study estimated that the total surface area of the Dead Sea is 800 km2 , of which 740 km2 in the northern part and only 60 km2 in the southern part. The altitude at the surfgace is around 400,5m.
In the beginning of eighties (1982) Jordan started the Potash Project, the Salt Pans have been built at the recession area of the southern part of the sea, Israel also used this area to expand its Salt Pans. Water in the rest of the southern part ad then in the northern part was used to provide the pans, hence the recession of the Dead Sea became larger.
3- Data
The data used in our study are the following black and white air-photos, Landsat images, and topographic maps:
- Topographic maps scale 1/1000,000dated on 1947
- Aerial photography scale 1/60,000 dated on 1961
- Topographic maps scale 1/100, 000 dated on 1961
- Landsat MSS image of January, 1973 (Color print)
- Landsat MSS image of January, 1975 (B and W print)
- Landsat MSS image of January 1983 (digital data)
- Landsat MSS image of April, 1987 (color print)
- Topographic map printed on 1988
- Landsat MSS image of April, 1994 (Digital Data)
The methodology of this study consists of the following steps:
- Collecting data from aerial photos. Maps. Printed and digital remote sensing data and literature.
- Transforming printed data to digital forms using EKONICS scanner.
- Performing geometric coretion of recent landsat TM (image 1994)
- Registering scanned data to the corrected image (e.e. convert the data to the same reference)
- Delineating the surface water representing the Dead Sea by visual interpretation of the different images. At this stage we subdivided the surface of the Dead Sea in three parts; the northern part, the southern part, and the Salt Pans.
- Computing the surface area of the three part at various time.
- Anlyzing and comparing information obtained about the areas of the three parts as a function of time, and examining the accuracy of information.
The following table shows the surface areas for different dates, the results categorized the following three parts : Dead Sea northern part Dead Sea southern part and Salt Pans.
| Year | Northern Surface | Southern Surface | Salt Pans | Northern & Southern subtotal |
| 1947 | 780 | 251 | 0 | 1031 |
| 1965 | 771 | 202 | 16 | 973 |
| 1973 | 756 | 169 | 26 | 925 |
| 1983 | 705 | 13 | 47 | 838 |
| 1994 | 683 | 65 | 156 | 748 |
The northern part difference in surface between 1973-1983 was (50km2) and between 1983-1994 was (22 km2) This due, in addition to the decreasing in the in flow of the Dead Sea, to the pumping of water to the principal salt pans, which in creased from (16km) on 1965 to (26km2) on 1973 and to (165 km2) on 1994
The southern part, whih is shallow, was more affected than the northern part where its surface was (251 km2) on 1947 decreased to (65 km2) on 1994, we have to note that the water in this part was used in providing the salt pans.
6-Conclusion
In conclusion of this study. Remote Sensing data can be considered as an efficient tools for delineation and assessing water bodies, such as the Dead Sea, it present an important technique for a temporal-anlysis as a method of controlling the dynamic process and fast changes on water bodies.
References
- Abdelqader Abed "Geology of the Dead Sea" 1985
- Salah alidin Buhairy "Geography of Jordan, 1991
- Salameh Elias, Banagan Helen "Water Resources of Jordan Present Staus and Feature Potentials" 1993
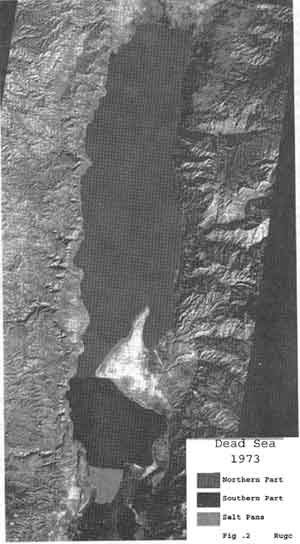
Fig 2
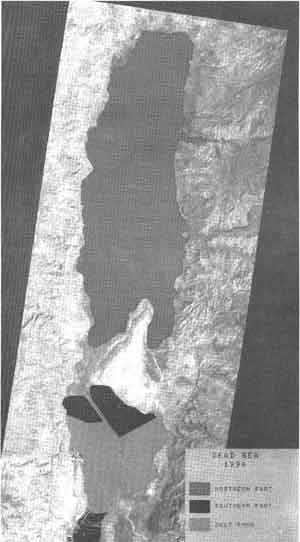
Fig 3