| GISdevelopment.net ---> AARS ---> ACRS 1994 ---> Poster Session |
Spectral Inputs Incorporation
into A Wheat Simulation Model for Improving Yield Predictability
F. Cheevasuvit, K. Dejhan and T. Pavitpok
Faculty of Engineering,
King Mognkut's Institute of Technology Ladkrabang.
Bangkok 10520, Thailand
Usha Kiran Chopra and D. K. Das
Division of Agricultural Physica
Indian Agricultural Research Institute
New Delhi-110012, India
F. Cheevasuvit, K. Dejhan and T. Pavitpok
Faculty of Engineering,
King Mognkut's Institute of Technology Ladkrabang.
Bangkok 10520, Thailand
Usha Kiran Chopra and D. K. Das
Division of Agricultural Physica
Indian Agricultural Research Institute
New Delhi-110012, India
Abstract
Growth simulation models developed I recent years have emerged as promising tools to increase the opportunities for analysing production potentials and the appropriate technologies to achieve them over a wide range of conditions. With the advance of modern remote sensing techniques, study of the application and utility of growth simulation model introducing remote sensing inputs holds great promise. In the present investigation, an attempt has been made to study the predictability of wheat yield through a dynamics simulation model using spectral vegetation indices. Spectral reflectances were recorded in a field experiment of wheat grown under differential soil moisture and nutrient regimes. The spectral vegetation indices such as IR/Red ratio and normalized difference (ND) were incorporation of these indices in plant growth processed on the predictability of biomass and yield of wheat is discussed.
Introduction
Remote sensing techniques have great potential in accurate and timely assessment, monitoring and management of land. Water and crop resources. Among the major application areas of remote sensing in crop resources study, significant progress has been made in land use/ land cover mapping and discrimination, identification and estimation of acreage of crops (Shai and Dadhwal, 1990 and Navalgund 1991). While the potentially of yield estimation using remotely sensed paramters has been demonstrated (Tucker et.a., 1980; Hatfield, 1983, DAS AND Kalrs 1990; Das e.at., 1993) accurate yield prediction of crops using these modern tools has remained a formidable task.
Among the three structurally different types of models the weather based models have been extensively used for yield prediction (Doorenbos and Kassam 1979). However, such models do not give emphasis to physiological aspects of plant growth. The significant correlations between crop reflectance factors and plant growth parameters have encouraged the use of spectral data in crop yield modeling. The remote sennsing models are primarily the regression models (Tucker et al. 1980; Das et al. 1993) where the physiology of growth is not directly taken into consideration. In recent years crop growth simulation models have been developed which have emerged as promising tools in increasing the opportunities for analysing production potentials and the appropriate technologies to achieve them over a wide range of conditions (van Keulen and Seligman 1987, Spites 1990). In crop growth simulation models the course of plant life is simulated by certain mathematical equations which describe each physiology process in proper in sequence. The plant processes such as assimilation, partitioning of assimilates and growth organs are evaluated for each time step, usually one day or one hour, submodels and the final output is crop yield. They require information soil properties, plant parameters and weather information for their calibration at a certain place and fir a definite plant type. While such plant growth simulation models have been found to be good estimators of yield (van Keulen and Seligman, 1987) the decrease in their predictability over large areas or on regional basis limit their applicability (Spitters 1990).
All the three structurally different types of models for yield estimation, are however, complementary to each other. For example, if daily weather information is available, actual properties of crop canopies like leaf area index, may be obtained from spectral data acquired by remote sensing techniques and fed to a simulation model. The crop behaviour described by it is likely to be close to reality. Thus with the advance of remote sensing inputs technology, study of the application and utility of growth simulation models introducing remote sensing inputs holds great promise. In the present investigation and attempt has been made to study predictability of wheat yield through a dynamic simulation model using spectral vegetation indices.
Materials and Methods
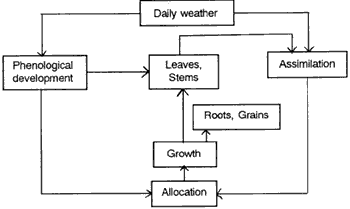
Simulation Model and Incorporation of Spectral Inputs : the crop growth simulation model of van Keulen and Seligman (1987) for potential yield production of wheat crop was used in the present study. The model is based on state variables approach and its integration time step and consequently its resolution is one day. The climatic data required for the model are daily reainfall, maximum and minimum air temperatures, total daily radiation, air humidity and wind velocity. The physiological processes considered in this model are phenological development, dry matter accumulation (assimilation), assimilate allocation and organ formation. The schematic structure of the simulation model is shown in Fig 1

Figure 1 Schematic structure of simulatution model (Van Keulen and Seligman, 1987)
The daily rate of gross CO2 assimilation of the canopy is calculated from the initial light use efficiency, the light saturated maximum photosynthetic rate of the light response curve for an individual leaf, the green area index (GRAI) of the canopy and the fraction of day for which sky is overcast. The model simulates phonological developments of plants from weather data which estimates the GRAI. The GRAI is taken to calculate gross CO2 assimilation. At this stage, instead of using estimated GRAI, if GRAI as determined by spectral reflectances is fed tot eh model, the simulated assimilations would be more closer to the true values since the spectral data when transformed into vegetation index, express the collective effect of several factors (Rudorff and Batista 1990). As the time interval at which the spectral data is available is greater than the integration time step of the model (1 day), the model is modified in such a way that it looks for GRAI first from remotely sensed data sub-model. If GRAI for that day is available it takes that GRAI and proceeds to simulate assimilation for that day. If GRAI is not available from remotely sensed data submodel, then the main model goes back and takes the estimated GRAI from the phonological development submodel and continues the simulation. Thus, the greater the number of days spectral data based GRAI is available, the model outputs is likely to be more towards actual values. The modified schematic structure of the simulation model with incorporation of spectral data is depicted in Fig. 2

Figure 2 Modified schematic structure of the model with incorporation of remote sensing inputs
Spectral data based GRAI : The GRAI was calculated using spectral reflectance indices such as normalized difference (ND) and IR/Red ratios. The linear regression equations developed by Das et.al (1985) for wheat based on experiments conduced at IARI were used for computation of GRAI which are as follows:
i) GRAI = 13.27 x - 4.17, where x = ND (r2 =
0.90)
ii) GRAI = 0.87 x - 2.0, where x = IR/Red (r2 = 0.90)
Spectral and yield data : Spectral reflectance characteristic of wheat were studies in field experiments conducted at IARI experimental farm, New Delhi, India with adequate supply of water and nutrient, so as to obtain potential production. The spectral indices computed from spectral data alongwith meterological data, different soil physical parameters and wheat crop parameters were used in the simulation model.
Computation : Initially the output of unmodified simulation model for biomass and grain yields were recorded. The modified model was run after incorporation of GRAI (Green area index) obtained from normalized difference (ND) spectral index. The modified model was run consecutively with one, two, three and four GRAI values and the simulated output for each run was recorded. Similarly the modified simulated output GRAI values determined by using IR/Red ratios were worked out.
Results and Discussions
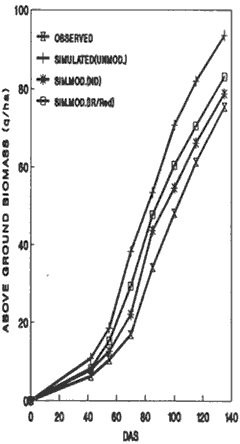
Biomass production : Simulated canopy biomass after incorporation of remote sensing inputs has been compared with biomass obtained from unmodified (sim unmod.) model and with measured biomass in the experimental field. At different stages of crop growth the sim.unmod. biomass was considerably higher that the observed biomass. With incorporation of remote sensing indices, the magnitude of overestimation of stimulated biomass greatly decreased. At harvest, the simulated biomass with spectral inputs (sim.mod.) were of the order of 12% (78.8 q/ha) to 18% (83.1 q/ha) higher with ND and IR/Red ratio, respectively) than the observed biomass production (75.4 q/ha), whereas sim.unmod. biomass was of the order of 93.55 q/ha which was about 24% higher than the observed values. Similar observations have been reported by Bouman (1992) for sugarbeat.

Figure 3 Observed and predicted above ground biomass during crop growth
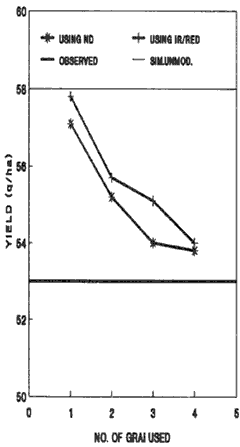
Grain yield : Data presented in Fig 4 revealed that the unmodified simulated wheat grain yield was 58.0 q/ha which was 9.4 per cent higher than the actual observed yields. As the number of GRAI values fed to the model increased, the quantum of overestimation reduced. The ND number of GRAI values reduced the magnitude to overestimation of yield by 1.7, 5.3, 7.5 and 9.3 % when 1,2,3 and 4 GRAI values, respectively, were fed, whereas incorporation of IR/Red ratio based GRAI values reduced the magnitude of overestimated values by 1.3, 4,3, 5,5, and 7.5 percent with the above different GRAI values, respectively increasing order. The results thus revealed that the grain yield prediction capability of the simulation model has improved considerably by inclusion of remote sensed data. The data (Fig 4) also showed that the model predictability was comparatively enhanced with ND based GRAI values that that of IR/Red ratios.

Figure 4 Observed and predicted grain yield of wheat as a function of green area index
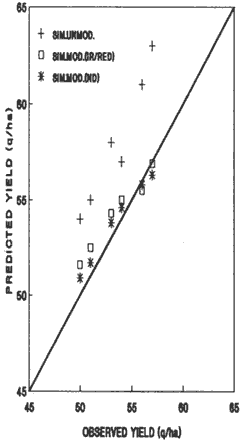
The validation of the modified spectral simulation growth model was carried out by taking wheat yield data from six different independent field experiments. A comparison between the observed and predicted yield (Fig. 5) showed that they were in good agreement.

Figure 5 Comparison between observed and predicted yield obtained through special inputs in simulation model
Conclusion
The results from the presents study demonstrate the usefulness of remote sensing inputs in crop growth simulation model in enhancing of biomass production and yield of crops. Incorporation of noramlised difference spectral index improved the model predictability to more accurate values of the spectral indices to green area indices which are to be used as inputs to the simulation model. Incorporation of greater number of GRAI would enhance the predictability of the model.
References
Growth simulation models developed I recent years have emerged as promising tools to increase the opportunities for analysing production potentials and the appropriate technologies to achieve them over a wide range of conditions. With the advance of modern remote sensing techniques, study of the application and utility of growth simulation model introducing remote sensing inputs holds great promise. In the present investigation, an attempt has been made to study the predictability of wheat yield through a dynamics simulation model using spectral vegetation indices. Spectral reflectances were recorded in a field experiment of wheat grown under differential soil moisture and nutrient regimes. The spectral vegetation indices such as IR/Red ratio and normalized difference (ND) were incorporation of these indices in plant growth processed on the predictability of biomass and yield of wheat is discussed.
Introduction
Remote sensing techniques have great potential in accurate and timely assessment, monitoring and management of land. Water and crop resources. Among the major application areas of remote sensing in crop resources study, significant progress has been made in land use/ land cover mapping and discrimination, identification and estimation of acreage of crops (Shai and Dadhwal, 1990 and Navalgund 1991). While the potentially of yield estimation using remotely sensed paramters has been demonstrated (Tucker et.a., 1980; Hatfield, 1983, DAS AND Kalrs 1990; Das e.at., 1993) accurate yield prediction of crops using these modern tools has remained a formidable task.
Among the three structurally different types of models the weather based models have been extensively used for yield prediction (Doorenbos and Kassam 1979). However, such models do not give emphasis to physiological aspects of plant growth. The significant correlations between crop reflectance factors and plant growth parameters have encouraged the use of spectral data in crop yield modeling. The remote sennsing models are primarily the regression models (Tucker et al. 1980; Das et al. 1993) where the physiology of growth is not directly taken into consideration. In recent years crop growth simulation models have been developed which have emerged as promising tools in increasing the opportunities for analysing production potentials and the appropriate technologies to achieve them over a wide range of conditions (van Keulen and Seligman 1987, Spites 1990). In crop growth simulation models the course of plant life is simulated by certain mathematical equations which describe each physiology process in proper in sequence. The plant processes such as assimilation, partitioning of assimilates and growth organs are evaluated for each time step, usually one day or one hour, submodels and the final output is crop yield. They require information soil properties, plant parameters and weather information for their calibration at a certain place and fir a definite plant type. While such plant growth simulation models have been found to be good estimators of yield (van Keulen and Seligman, 1987) the decrease in their predictability over large areas or on regional basis limit their applicability (Spitters 1990).
All the three structurally different types of models for yield estimation, are however, complementary to each other. For example, if daily weather information is available, actual properties of crop canopies like leaf area index, may be obtained from spectral data acquired by remote sensing techniques and fed to a simulation model. The crop behaviour described by it is likely to be close to reality. Thus with the advance of remote sensing inputs technology, study of the application and utility of growth simulation models introducing remote sensing inputs holds great promise. In the present investigation and attempt has been made to study predictability of wheat yield through a dynamic simulation model using spectral vegetation indices.
Materials and Methods
Simulation Model and Incorporation of Spectral Inputs : the crop growth simulation model of van Keulen and Seligman (1987) for potential yield production of wheat crop was used in the present study. The model is based on state variables approach and its integration time step and consequently its resolution is one day. The climatic data required for the model are daily reainfall, maximum and minimum air temperatures, total daily radiation, air humidity and wind velocity. The physiological processes considered in this model are phenological development, dry matter accumulation (assimilation), assimilate allocation and organ formation. The schematic structure of the simulation model is shown in Fig 1

Figure 1 Schematic structure of simulatution model (Van Keulen and Seligman, 1987)
The daily rate of gross CO2 assimilation of the canopy is calculated from the initial light use efficiency, the light saturated maximum photosynthetic rate of the light response curve for an individual leaf, the green area index (GRAI) of the canopy and the fraction of day for which sky is overcast. The model simulates phonological developments of plants from weather data which estimates the GRAI. The GRAI is taken to calculate gross CO2 assimilation. At this stage, instead of using estimated GRAI, if GRAI as determined by spectral reflectances is fed tot eh model, the simulated assimilations would be more closer to the true values since the spectral data when transformed into vegetation index, express the collective effect of several factors (Rudorff and Batista 1990). As the time interval at which the spectral data is available is greater than the integration time step of the model (1 day), the model is modified in such a way that it looks for GRAI first from remotely sensed data sub-model. If GRAI for that day is available it takes that GRAI and proceeds to simulate assimilation for that day. If GRAI is not available from remotely sensed data submodel, then the main model goes back and takes the estimated GRAI from the phonological development submodel and continues the simulation. Thus, the greater the number of days spectral data based GRAI is available, the model outputs is likely to be more towards actual values. The modified schematic structure of the simulation model with incorporation of spectral data is depicted in Fig. 2

Figure 2 Modified schematic structure of the model with incorporation of remote sensing inputs
Spectral data based GRAI : The GRAI was calculated using spectral reflectance indices such as normalized difference (ND) and IR/Red ratios. The linear regression equations developed by Das et.al (1985) for wheat based on experiments conduced at IARI were used for computation of GRAI which are as follows:
ii) GRAI = 0.87 x - 2.0, where x = IR/Red (r2 = 0.90)
Spectral and yield data : Spectral reflectance characteristic of wheat were studies in field experiments conducted at IARI experimental farm, New Delhi, India with adequate supply of water and nutrient, so as to obtain potential production. The spectral indices computed from spectral data alongwith meterological data, different soil physical parameters and wheat crop parameters were used in the simulation model.
Computation : Initially the output of unmodified simulation model for biomass and grain yields were recorded. The modified model was run after incorporation of GRAI (Green area index) obtained from normalized difference (ND) spectral index. The modified model was run consecutively with one, two, three and four GRAI values and the simulated output for each run was recorded. Similarly the modified simulated output GRAI values determined by using IR/Red ratios were worked out.
Results and Discussions
Biomass production : Simulated canopy biomass after incorporation of remote sensing inputs has been compared with biomass obtained from unmodified (sim unmod.) model and with measured biomass in the experimental field. At different stages of crop growth the sim.unmod. biomass was considerably higher that the observed biomass. With incorporation of remote sensing indices, the magnitude of overestimation of stimulated biomass greatly decreased. At harvest, the simulated biomass with spectral inputs (sim.mod.) were of the order of 12% (78.8 q/ha) to 18% (83.1 q/ha) higher with ND and IR/Red ratio, respectively) than the observed biomass production (75.4 q/ha), whereas sim.unmod. biomass was of the order of 93.55 q/ha which was about 24% higher than the observed values. Similar observations have been reported by Bouman (1992) for sugarbeat.

Figure 3 Observed and predicted above ground biomass during crop growth
Grain yield : Data presented in Fig 4 revealed that the unmodified simulated wheat grain yield was 58.0 q/ha which was 9.4 per cent higher than the actual observed yields. As the number of GRAI values fed to the model increased, the quantum of overestimation reduced. The ND number of GRAI values reduced the magnitude to overestimation of yield by 1.7, 5.3, 7.5 and 9.3 % when 1,2,3 and 4 GRAI values, respectively, were fed, whereas incorporation of IR/Red ratio based GRAI values reduced the magnitude of overestimated values by 1.3, 4,3, 5,5, and 7.5 percent with the above different GRAI values, respectively increasing order. The results thus revealed that the grain yield prediction capability of the simulation model has improved considerably by inclusion of remote sensed data. The data (Fig 4) also showed that the model predictability was comparatively enhanced with ND based GRAI values that that of IR/Red ratios.

Figure 4 Observed and predicted grain yield of wheat as a function of green area index
The validation of the modified spectral simulation growth model was carried out by taking wheat yield data from six different independent field experiments. A comparison between the observed and predicted yield (Fig. 5) showed that they were in good agreement.

Figure 5 Comparison between observed and predicted yield obtained through special inputs in simulation model
Conclusion
The results from the presents study demonstrate the usefulness of remote sensing inputs in crop growth simulation model in enhancing of biomass production and yield of crops. Incorporation of noramlised difference spectral index improved the model predictability to more accurate values of the spectral indices to green area indices which are to be used as inputs to the simulation model. Incorporation of greater number of GRAI would enhance the predictability of the model.
References
- Bouman, B.A.M 1992 Int. J. Remote Sensing 13 : 2565-2581
- Das, D.K and Kalrs, N. 1990 In Technology Belnding and Agrarian Prosperity, edited by J.p. Verma ad A Verma (New Delhi, India: Malhotra Publishing House) pp 99-118
- Das, D.K Singh.G. and Sutradhar, A.K 1985, 6th Asian conference on Remote Sensing NRSA, Hyderabad, India 21-26 November 1985 pp. 400-405.
- Das, D.K Mishra, K.K and Karla N. 1993 Int. J. Remote Sensing 14 : 3081-3092
- Doorenbos, J and K.K Kassam, A.H 1979. FAO Plant Production and Protection Paper No 33 : FAO (UN), Rome.
- Hatfield, J.L 1983, remote Sens Environ 13 (4) : 301-311
- Navalgund, R.R 1991. in Space and Agriculture Management. Special Current Event Session. International Astronomical Federation 42nd IAF Congress, Montrea, Canada pp. 31-50.
- Richardson A.J Weighand C.L Arkin G.F Nixon P.R and Gerbermann, A.H 1982, Agric Meterol. 26 (): 11-23
- Rudorff, B.F.T and Batista, gT 1990, Remtoe Sens, Environ 33 : 183-192.
- Sahai, B. and Dadhwal, V.K 1990. in Technology Blending and Agarrian Properity, edited by J.P. Verma and A Varma, Malhotra Publshing House, New Delhi, India, pp 83-97.
- Spitters, C.JT 1990, Acta Horticulture 267, p.345-363
- Tucker, C.J Holben, B.N Elgin J.H and Mc Murtey J.E 1980 Remote Sens Environ 11 : 171- 89.
- Van Keulen, h. and Sligmen, N.G 1987. in simulation of water use, nitrogen nutrition and growth of spring crop. Pudoc Wageningen pp 1-310.