| GISdevelopment.net ---> AARS ---> ACRS 1994 ---> Poster Session |
Reconstruction of 3-dimension
image from topographic map and satellite image
F. Cheevasuvit, K. Dejhan and T. Pavitpok
Faculty of Engineering,
King Mognkut's Institute of Technology Ladkrabang.
Bangkok 10520, Thailand
E. Prommas
Faculty of Engineering, Kasem Bundit University, Patanakarn Road
Bangkok 10250, Thailand
F. Cheevasuvit, K. Dejhan and T. Pavitpok
Faculty of Engineering,
King Mognkut's Institute of Technology Ladkrabang.
Bangkok 10520, Thailand
E. Prommas
Faculty of Engineering, Kasem Bundit University, Patanakarn Road
Bangkok 10250, Thailand
Abstract
Digital terrain model (DTM) is currently used n various applications. However, there have not any that organization provide the DTM data for public. In this paper, we try to generate the DTM data by ourselves. The terrain elevation information is acquired by using scanner machine over the topographic map with scale 1:50,000. Three couples of thresholds are applied to the digitized color map for obtaining the binary contour map. The contour thinning is attained by skeleton procedure while the contour connection is performed by manual editing. The cubic spline interpolation is applied to calculate the height of each pixel in order to plot on the screen as 3-dimentional graphic. Finally the satellite data are combined with this graphic to obtain 3-dimentional image.
Introduction
Since it is quire difficult to imagine the terrain elevation by using the contours information from topographic map. However, there have not any thai organization who takes in charge the responsibility for producing digital terrain model (DTM). Therefore, we try to generate the DTM data by ourselves with based on microcomputer ourselves with based on microcomputer. By this ways the remote organization, which has not so much budget, can be accomplished the work concerned with the terrain elevation.
The DTM data can be acquired by using scanner machine which is connected to the microcomputer. The contours topographic map are digitized and stored in the binary from. Th obtained contours are thicked and broken, so thinning and connecting process are applied to generate the perfect contours.
The cubic spline is used a interpolate technique for calculating the height of the pixels located between the contours. The 3 dimensional graphic is plotted by using the high information. Finally, the reflectance from satellite imagery data is combined into the graphic for reconstructing a 3-dimensional image. The detail of each process can be described as the following paragraph.
Thinning Procedure
The contour lines are obtained by scanning the topographic map. Since the topographic map is colored. Therefore, a set of threshold from each color band (red, green, blue) is applied to obtain a binary contour map. The contour liens in the resultant map are thicks. Then the thinning algorithm (30 is applied to yield the one pixel thickness contour lines. These thinning algorithm can be described by the following.
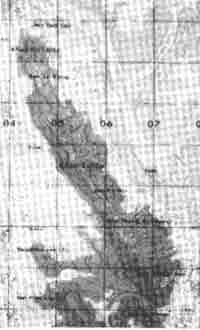
Figure 1 Coloured contour map
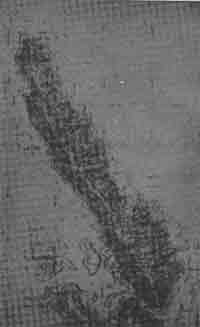
Figure 2 Binary contour map
Supposed that in the contour region, a contour pixel P1 is any pixel with value 1 and having at least one 8 neighbour valued 01. The thinning procedure compose of 2 steps.
Step 1 A contour pixel P1 will be deleted if the following condition are satisfied.
a) 2 < N(P1) < 6
b) S(P1) = 1;
c) P2.P4.P6 = 0
d) P4.P6.P8 = 0
Where N(P1) is the number of nonzero neighbors of P1 and S(P1) is the number of 0 to 1 transitions in the ordered sequence of P2, P3,……….,P8, P9
If one or more of conditions (a) - (d) are violated., the value of the pixel in question is not changed.
Step 2 The conditions (a) and (b) still remain the same as in step 1, but the condition (c) and (d) will be changed to
c) P2 . P4 . P8 =0
d) P2. P6. P8 = 0
This step is applied to the resulting data in exactly the same manner as step 1.
The procedure will be applied iteratively until no further promits are deleted. A thin contour ma will be achieved.
Figure 3 8-neighbor of contour pixel p1
By applying this procedure to the image in Fig 2. The result of thin contours is shown in Fig 4.
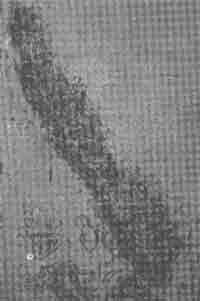
Figure 4 Thin contour map
However, there are some broken contour lines and also the map symbols still present in the resultants. The manual correction is den for connecting the contour liens and deleting the map symbols to obtain a perfect contour map as shown in fig.5. The height of each contour line ill be assigned in the computer memory.
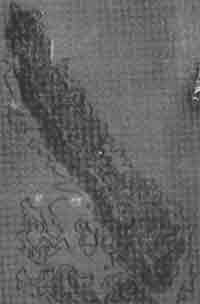
Figure 5 Perdect contour map
Cubic Spline Interpolation
To create a 3-dimentional graphic of DTM data, it should know the height of each pixel. Therefore, the cubic spline interpolation is applied to the contour map. The height of each pixel will be calculated by third degree polynomial (4) which shows in the following equation.
Si(x) = aix3 +
bix2 +cix + di ; i = 1,2,…,N -
1
With Si (x) defined as the cubic polynomial to be used in interval between pixel xi and pixel xi + 1. The spline coefficients a,b,c and d are computed by the given x pixels and y values.
By applying the cubic spline interpolation to contour map of Fig. 5. The resulting of 3-dimensional graphic is ploted as Fig.6
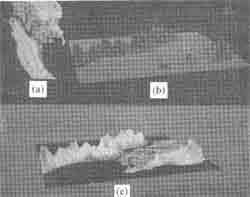
Figure 6. 3-dimensional image, (a) MOS-1 MESSR image,
(b) -dimensional graphic of DTM data,
(c) results of -dimension image by combining Fig 6(a) and 6(b) together.
Reconstruction of 3-dimensional image
The DTM data will be combined with the satellite imagery data to reconstruct a 3-dimensional image. The result of 3-dimensional image will be shown in Fig 6. The satelline image of Fig 6 (a) is obtained by MOS-I MESSR over Lunta Island which is in the southern part of Thailand. The Fig 6(b) is the 3-dimensional graphic. The result of 3-dimensional image is shown in Fig 6 (c).
Conclusions
This paper presents a method for generating DTM data and reconstruction of 3-D image, the complete process can be presented the flow charge of Fig. 7. This kind of image is very useful in widely application such as for establishing the microwave repeater station, determining the slope of mountain in order to find away to tidal wave and etc.
Figure 7 Block diagram of 3-dimensional image reconstruction
References
Digital terrain model (DTM) is currently used n various applications. However, there have not any that organization provide the DTM data for public. In this paper, we try to generate the DTM data by ourselves. The terrain elevation information is acquired by using scanner machine over the topographic map with scale 1:50,000. Three couples of thresholds are applied to the digitized color map for obtaining the binary contour map. The contour thinning is attained by skeleton procedure while the contour connection is performed by manual editing. The cubic spline interpolation is applied to calculate the height of each pixel in order to plot on the screen as 3-dimentional graphic. Finally the satellite data are combined with this graphic to obtain 3-dimentional image.
Introduction
Since it is quire difficult to imagine the terrain elevation by using the contours information from topographic map. However, there have not any thai organization who takes in charge the responsibility for producing digital terrain model (DTM). Therefore, we try to generate the DTM data by ourselves with based on microcomputer ourselves with based on microcomputer. By this ways the remote organization, which has not so much budget, can be accomplished the work concerned with the terrain elevation.
The DTM data can be acquired by using scanner machine which is connected to the microcomputer. The contours topographic map are digitized and stored in the binary from. Th obtained contours are thicked and broken, so thinning and connecting process are applied to generate the perfect contours.
The cubic spline is used a interpolate technique for calculating the height of the pixels located between the contours. The 3 dimensional graphic is plotted by using the high information. Finally, the reflectance from satellite imagery data is combined into the graphic for reconstructing a 3-dimensional image. The detail of each process can be described as the following paragraph.
Thinning Procedure
The contour lines are obtained by scanning the topographic map. Since the topographic map is colored. Therefore, a set of threshold from each color band (red, green, blue) is applied to obtain a binary contour map. The contour liens in the resultant map are thicks. Then the thinning algorithm (30 is applied to yield the one pixel thickness contour lines. These thinning algorithm can be described by the following.
Figure 1 Coloured contour map
Figure 2 Binary contour map
Supposed that in the contour region, a contour pixel P1 is any pixel with value 1 and having at least one 8 neighbour valued 01. The thinning procedure compose of 2 steps.
Step 1 A contour pixel P1 will be deleted if the following condition are satisfied.
a) 2 < N(P1) < 6
b) S(P1) = 1;
c) P2.P4.P6 = 0
d) P4.P6.P8 = 0
Where N(P1) is the number of nonzero neighbors of P1 and S(P1) is the number of 0 to 1 transitions in the ordered sequence of P2, P3,……….,P8, P9
If one or more of conditions (a) - (d) are violated., the value of the pixel in question is not changed.
Step 2 The conditions (a) and (b) still remain the same as in step 1, but the condition (c) and (d) will be changed to
c) P2 . P4 . P8 =0
d) P2. P6. P8 = 0
This step is applied to the resulting data in exactly the same manner as step 1.
The procedure will be applied iteratively until no further promits are deleted. A thin contour ma will be achieved.
| P9 | P2 | P3 |
| P8 | P1 | P4 |
| P7 | P6 | P5 |
Figure 3 8-neighbor of contour pixel p1
By applying this procedure to the image in Fig 2. The result of thin contours is shown in Fig 4.
Figure 4 Thin contour map
However, there are some broken contour lines and also the map symbols still present in the resultants. The manual correction is den for connecting the contour liens and deleting the map symbols to obtain a perfect contour map as shown in fig.5. The height of each contour line ill be assigned in the computer memory.
Figure 5 Perdect contour map
Cubic Spline Interpolation
To create a 3-dimentional graphic of DTM data, it should know the height of each pixel. Therefore, the cubic spline interpolation is applied to the contour map. The height of each pixel will be calculated by third degree polynomial (4) which shows in the following equation.
With Si (x) defined as the cubic polynomial to be used in interval between pixel xi and pixel xi + 1. The spline coefficients a,b,c and d are computed by the given x pixels and y values.
By applying the cubic spline interpolation to contour map of Fig. 5. The resulting of 3-dimensional graphic is ploted as Fig.6
Figure 6. 3-dimensional image, (a) MOS-1 MESSR image,
(b) -dimensional graphic of DTM data,
(c) results of -dimension image by combining Fig 6(a) and 6(b) together.
Reconstruction of 3-dimensional image
The DTM data will be combined with the satellite imagery data to reconstruct a 3-dimensional image. The result of 3-dimensional image will be shown in Fig 6. The satelline image of Fig 6 (a) is obtained by MOS-I MESSR over Lunta Island which is in the southern part of Thailand. The Fig 6(b) is the 3-dimensional graphic. The result of 3-dimensional image is shown in Fig 6 (c).
Conclusions
This paper presents a method for generating DTM data and reconstruction of 3-D image, the complete process can be presented the flow charge of Fig. 7. This kind of image is very useful in widely application such as for establishing the microwave repeater station, determining the slope of mountain in order to find away to tidal wave and etc.
Figure 7 Block diagram of 3-dimensional image reconstruction
References
- D.F Rogers and J.A Adams, Mathematical Elements for Computer graphics Mc Graw-Hill New York 976.
- K.S Fu, RC Gonzalez and C.S.G Lee, Robotic : Control sensing vision and intelligence Mc GrawHill NEW York 1987
- R.C Gonzalez R.E Woods, Digital Image Processing", Addision Wesley Publishing company Inc. 1992.
- R. Sedgewick,. Algorithms Addison -Wesley Publishing Company Inc. 1988
- S. Nakamura, Applied Numerical Moethosin C, Prentice Hall International 1993.
- S. Rimmer, Supercharged Bitmapped graphics, Windcrest Books 1992.
- S. Viseshisin, T. Hashimoto and S. Murai, Interactive System for Automated Generation of DTM from existing Topographic Map of Thailkand in 9th ACRS pp.s-5-1-2-5-6 Bangkok 1988.