| GISdevelopment.net ---> AARS ---> ACRS 1994 ---> Poster Session |
Alteration Mapping by Remote
Sensing Techniques in South Iran - A Case Study
Iraj Navai & Simin MehdiZadej-Tehrani
Remote Sensing Group
Geological Survey of Iran (GSI)
P.O. BOX : 13185 - 1494 Tehran - Iran Fax : 60093378
Iraj Navai & Simin MehdiZadej-Tehrani
Remote Sensing Group
Geological Survey of Iran (GSI)
P.O. BOX : 13185 - 1494 Tehran - Iran Fax : 60093378
Abstract
This study reports into mapping hydrothermal alterations as an aid to prospecting for epithermal mineral deposits in the Orumieh - Dokhtar volcanic belt of Iran. The Sarcheschmeh porphyry copper mine in the Pariz region was selected with a known alternation zone and ore deposite as training site for design of enhancement techniques for application in high lighting of hydrothermal alteration minerals.
The aim of this study was assess the effectiveness of TM data for detecting alteration zones. For this purpose different techniques from combined rock and vegetation enhancement. Well established method of algebraic operations among spectral bands, such as difference (Moore, et al., 1993), ratio and principal component analysis can be applied for the purpose. A hybrid P.C and difference colour composite achieved the most effective separation of hydrothermal alteration (high, medium and low) could be appeared much clearly.
1. Introduction
The Sarcheshmesh copper and molybdenium mine operate or porphyry copper within a belt of Palegene Neogene volcanics in the Pariz region of south-central Iran. The orebody is contained in hydrothermally-altered sub-volcanic and intrusive rocks. A landsat thematic mapper (TM) image (9/12/1990, orbit 161-39) has been used to identify area within Pariz region which show the same spectral features as hydrothermal alteration in and near the mine site. These newly located areas of hydrothermal alteration minerals field checked for prospecting potential.
1.1 Geological Setting
The study area is located in South Central Iran within Orumieh - Dokhtar volcanic belt. The district is mountainous, reaching altitudes of 3280 meters.
The Eocene volcano clastic and sedimentary rocks with thousand meters thicknes, including trachy-andesite, tracky-basaltic iavas, pyroclastic, sandstone, shale and limestone are the main our croppes in this area.
The volcanics overlie basement strata uncomformably and are themselves flanked and overlain by Quaternary deposits.
The platonic rocks form discordant massives and stocks in the Eocene complex and accompanies by numerous dykes. The intrusives are basically monzonite granodiorite with transition to syenite.
The intrusions have thermally metamorphosed adjacent host rocks and created swarms hydrothermal veins, some which contain bodies of minerals.
Hydrothermal activity has created extensive areas of aryillic alteration in both intrusions and surrounding volcanic.
1.2 Remote Sensing Image
Landsat Thematic Mapper imagery is made up of seven spatially co-registered spectral bands. Six bands (Tm bands 1,2,3,4,5 and 7) cover the spectral range from visible blue to the near infra red (0.4-2.5 m). spatial resolution (30 meter pixels) in the six viznir band images allows the imagery to be used at map scale as detailed as 1:50000. A seventh band TM6, representing the thermal infra-red spectral range (8-11 m) was not used in this study because of its lower spatial resolution (120 meter pixels).
2. Digital Image Enhancement and Interpretation
The first stage of the image enhancement programme was to chose the TM sab-scene of geologically well documented and mapped area with known alteration zones (Pariz region) and ore deposit (Sarcheshmesh mine) as "training site" for design of enhancement techniques for regional application in both geological mapping and high lighting of hydrothermal alteration minerals. For this purpose a sub-scene 36x36 km (1024 x 1024 lines/pixels) of Sarchehmesh copper mine area was selected from a cloud free, complete 185 x 185 KM Landsat TM Scene.
2.1 Fakse Colour composite images for Rock Type Enhancement
The most suitable imagery for discrimination and delineation of out cropping rock types in the study area are three bands colour composite images which produced by co-registered three bands display using red, green and blue "VDU" colour gunes. The choice of image bands must be on the basis of known spectral reflectance properties of the rocks and soils in relation to TM bands.
In order to achieve the optimised colour presentation of the image, the three ands used for colour composition must be carefully contract enhanced. In this study the best contrast enhancement results, were produced by the Balanced contrast enhancement Technique (BCET) (Liu 1991).
TM bands "BCET" colour composites were produced to illustrate the lithological variations, soils and vegetation in the Pariz area such as :
TM bands 2,3 and 4 displayed as blue, green and red to illustrate the variations of rock types.
The colour composite of TM bands 1,3 and 5 displayed as blue, green and red achieves the best discrimination of rock types and superficial deposits, in the test area. In this image the volcanic rock type and the 01igoscene granodioritediorite coomposition intrusive bodies are clearly highlighted.
2.2 Selective Enhancement of Agrillic Alteration and iron Minerals
Selective highlighting of ferruginous minerals of agrillic hydrothermal alterations in TM Imagery requires different techniques from combined rock and vegetation enhancement. Well established techniques of algebraic operations among spectral bands, such as difference (Subtraction) (Moore, et al. 1993) and ratio (Goetz, et al, 1975) and principal component analysis can be applied for the purpose.
In general, TM and ratios of 3.1, 4/2 and 5/7 selectively enhance ferruginous soils (red feature), vegetation and clay minerals individually (Drury 1992). The difference images of the three TM and pairs (e.g. 3-1.5-7 and 4-2) enhance the same phenomena but with much simpler operation.
A colour composite of TM band difference images 3-1 in blue, 4-2 in green and 5-7 in red of the Sarcheshmeh sub scene clearly highlights red soils and iron oxides in cyan, vegetation in green and alteration zones in pink. This image is very effective fire enhancement of these three main spectral features, especially the iron oxides but not adequate for exclusive detection of alterations zones and their variation that is important for locating the high degree alteration linking to porphyry copper ore deposits.
A hybrid PC and difference colour composite was then tried out based on the experiment of interactive processing and spectral analysis of the target sites. This image is composted of PC4 and PC5 (derived from six reflective spectral bands of TM) as red and green and difference of TM bands 5-7 as blue. It suppresses the variation among different rock types however enhances the alteration zones effectively. The zones with degrading degree of alteration can be clearly distinguished based on the hybrid colour composite.
High degree alteration zone with porphyry copper ore deposit in pink. The well known sorcheshmeh copper mine is in this zone.
Medium alteration zone with considerable copper minerization in mauve.
Low degree alteration zone with limited occurrence of copper mineralization in dark purple.
Ferruginous soils and iron stained rock outcrops are also well enhanced in dark green
Selected locations of the above alteration zones have been checked in field and the results confirm that the technique discriminated epithermal alteration very successfully.
3. Conclusions
Landsat TM imagery of Pariz region in south-central Iran was processed for the purposes of regional lithological mapping and mineral exploration for copper and related mineral deposits.
BCET enhanced TM colour composite of bands, 1,3 and 5 in blue, green and red was found the most useful for lithological mapping.
Color composites of TM band difference images 3-1 in blues, 4-2 in green and 5-7 in red was effective for mapping of iron oxide, epithermal alteration and vegetation, but not adequate for evaluation of the degree of alteration. A hybrid color composite of PC5, PC4 and bands 5-7 in red, green and blue exclusively enhanced the alteration zones. The alteration zones can be categorized as three groups regarding degree. The high degree group links to the known porphyry copper deposits directly.
4. Acknowledgement
We would like to take this opportunity to express thanks to Dr. M. Ahmadzadeh-Heravi general director of the GSI, for his support. We thank to Dr. J.Mc. Moor and Dr. Liu J.G, Deptt. Of Geology. Imperial college of London for their valuable suggestion and advice. We are grateful to our colleagues in the Remote sensing group of GSI.
5. References
Figure 1 Location map of study area
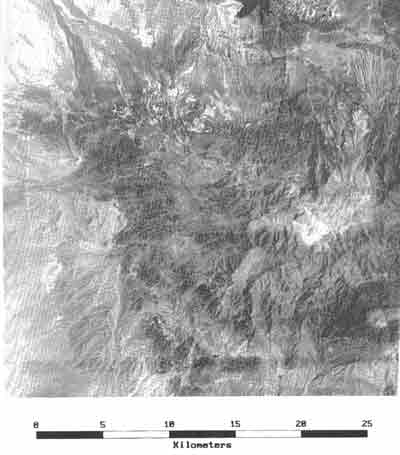
Figure 2 Colour composite of TM bands 5.3 and 1. with BCET enhancement for lithological mapping

Figure 3 Colour composite of difference bands (5-7.4-2 and 3-1) for alteration mapping
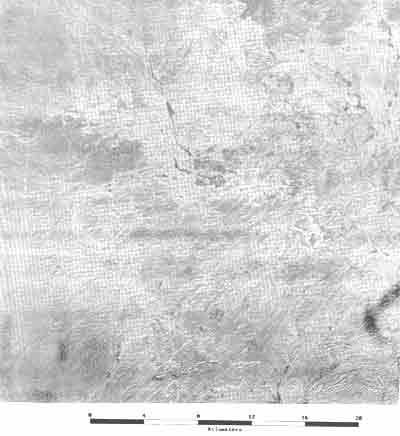
Figure 4 Hybrid colour composite of principal component 5.4 and difference (5-7), showing different altered Zones
This study reports into mapping hydrothermal alterations as an aid to prospecting for epithermal mineral deposits in the Orumieh - Dokhtar volcanic belt of Iran. The Sarcheschmeh porphyry copper mine in the Pariz region was selected with a known alternation zone and ore deposite as training site for design of enhancement techniques for application in high lighting of hydrothermal alteration minerals.
The aim of this study was assess the effectiveness of TM data for detecting alteration zones. For this purpose different techniques from combined rock and vegetation enhancement. Well established method of algebraic operations among spectral bands, such as difference (Moore, et al., 1993), ratio and principal component analysis can be applied for the purpose. A hybrid P.C and difference colour composite achieved the most effective separation of hydrothermal alteration (high, medium and low) could be appeared much clearly.
1. Introduction
The Sarcheshmesh copper and molybdenium mine operate or porphyry copper within a belt of Palegene Neogene volcanics in the Pariz region of south-central Iran. The orebody is contained in hydrothermally-altered sub-volcanic and intrusive rocks. A landsat thematic mapper (TM) image (9/12/1990, orbit 161-39) has been used to identify area within Pariz region which show the same spectral features as hydrothermal alteration in and near the mine site. These newly located areas of hydrothermal alteration minerals field checked for prospecting potential.
1.1 Geological Setting
The study area is located in South Central Iran within Orumieh - Dokhtar volcanic belt. The district is mountainous, reaching altitudes of 3280 meters.
The Eocene volcano clastic and sedimentary rocks with thousand meters thicknes, including trachy-andesite, tracky-basaltic iavas, pyroclastic, sandstone, shale and limestone are the main our croppes in this area.
The volcanics overlie basement strata uncomformably and are themselves flanked and overlain by Quaternary deposits.
The platonic rocks form discordant massives and stocks in the Eocene complex and accompanies by numerous dykes. The intrusives are basically monzonite granodiorite with transition to syenite.
The intrusions have thermally metamorphosed adjacent host rocks and created swarms hydrothermal veins, some which contain bodies of minerals.
Hydrothermal activity has created extensive areas of aryillic alteration in both intrusions and surrounding volcanic.
1.2 Remote Sensing Image
Landsat Thematic Mapper imagery is made up of seven spatially co-registered spectral bands. Six bands (Tm bands 1,2,3,4,5 and 7) cover the spectral range from visible blue to the near infra red (0.4-2.5 m). spatial resolution (30 meter pixels) in the six viznir band images allows the imagery to be used at map scale as detailed as 1:50000. A seventh band TM6, representing the thermal infra-red spectral range (8-11 m) was not used in this study because of its lower spatial resolution (120 meter pixels).
2. Digital Image Enhancement and Interpretation
The first stage of the image enhancement programme was to chose the TM sab-scene of geologically well documented and mapped area with known alteration zones (Pariz region) and ore deposit (Sarcheshmesh mine) as "training site" for design of enhancement techniques for regional application in both geological mapping and high lighting of hydrothermal alteration minerals. For this purpose a sub-scene 36x36 km (1024 x 1024 lines/pixels) of Sarchehmesh copper mine area was selected from a cloud free, complete 185 x 185 KM Landsat TM Scene.
2.1 Fakse Colour composite images for Rock Type Enhancement
The most suitable imagery for discrimination and delineation of out cropping rock types in the study area are three bands colour composite images which produced by co-registered three bands display using red, green and blue "VDU" colour gunes. The choice of image bands must be on the basis of known spectral reflectance properties of the rocks and soils in relation to TM bands.
In order to achieve the optimised colour presentation of the image, the three ands used for colour composition must be carefully contract enhanced. In this study the best contrast enhancement results, were produced by the Balanced contrast enhancement Technique (BCET) (Liu 1991).
TM bands "BCET" colour composites were produced to illustrate the lithological variations, soils and vegetation in the Pariz area such as :
TM bands 2,3 and 4 displayed as blue, green and red to illustrate the variations of rock types.
The colour composite of TM bands 1,3 and 5 displayed as blue, green and red achieves the best discrimination of rock types and superficial deposits, in the test area. In this image the volcanic rock type and the 01igoscene granodioritediorite coomposition intrusive bodies are clearly highlighted.
2.2 Selective Enhancement of Agrillic Alteration and iron Minerals
Selective highlighting of ferruginous minerals of agrillic hydrothermal alterations in TM Imagery requires different techniques from combined rock and vegetation enhancement. Well established techniques of algebraic operations among spectral bands, such as difference (Subtraction) (Moore, et al. 1993) and ratio (Goetz, et al, 1975) and principal component analysis can be applied for the purpose.
In general, TM and ratios of 3.1, 4/2 and 5/7 selectively enhance ferruginous soils (red feature), vegetation and clay minerals individually (Drury 1992). The difference images of the three TM and pairs (e.g. 3-1.5-7 and 4-2) enhance the same phenomena but with much simpler operation.
A colour composite of TM band difference images 3-1 in blue, 4-2 in green and 5-7 in red of the Sarcheshmeh sub scene clearly highlights red soils and iron oxides in cyan, vegetation in green and alteration zones in pink. This image is very effective fire enhancement of these three main spectral features, especially the iron oxides but not adequate for exclusive detection of alterations zones and their variation that is important for locating the high degree alteration linking to porphyry copper ore deposits.
A hybrid PC and difference colour composite was then tried out based on the experiment of interactive processing and spectral analysis of the target sites. This image is composted of PC4 and PC5 (derived from six reflective spectral bands of TM) as red and green and difference of TM bands 5-7 as blue. It suppresses the variation among different rock types however enhances the alteration zones effectively. The zones with degrading degree of alteration can be clearly distinguished based on the hybrid colour composite.
High degree alteration zone with porphyry copper ore deposit in pink. The well known sorcheshmeh copper mine is in this zone.
Medium alteration zone with considerable copper minerization in mauve.
Low degree alteration zone with limited occurrence of copper mineralization in dark purple.
Ferruginous soils and iron stained rock outcrops are also well enhanced in dark green
Selected locations of the above alteration zones have been checked in field and the results confirm that the technique discriminated epithermal alteration very successfully.
3. Conclusions
Landsat TM imagery of Pariz region in south-central Iran was processed for the purposes of regional lithological mapping and mineral exploration for copper and related mineral deposits.
BCET enhanced TM colour composite of bands, 1,3 and 5 in blue, green and red was found the most useful for lithological mapping.
Color composites of TM band difference images 3-1 in blues, 4-2 in green and 5-7 in red was effective for mapping of iron oxide, epithermal alteration and vegetation, but not adequate for evaluation of the degree of alteration. A hybrid color composite of PC5, PC4 and bands 5-7 in red, green and blue exclusively enhanced the alteration zones. The alteration zones can be categorized as three groups regarding degree. The high degree group links to the known porphyry copper deposits directly.
4. Acknowledgement
We would like to take this opportunity to express thanks to Dr. M. Ahmadzadeh-Heravi general director of the GSI, for his support. We thank to Dr. J.Mc. Moor and Dr. Liu J.G, Deptt. Of Geology. Imperial college of London for their valuable suggestion and advice. We are grateful to our colleagues in the Remote sensing group of GSI.
5. References
- Drury S.A (1993). Image interpretationin geology second edition, London : Allen & Unwin.
- Report No Yu/53. GSI.(1973). Exploration for ore deposits in Kerman region 217P.
- Liu J.G (1991). Balance Enhancement Technique and its application colour composition. International Journal of Remote Sensing. Vol. 2. No. 10. P-2133-2151.
- Lougblin W.P. (1991). Principal Component. Analysis for alteration mapping. Photogrammetric Engineering and Remote Sensing; Sept. 1991, Vol 57. No.
- Magee R.W, Moore J.MCM and Brunner J. (1986). Thematic Mapper applied to mapping hydrothermal alteration in southwest New Mexico. In. proc. Fifth Thematic conference on Remote Sensing for Exploration Geology p.p. 373-382.
- Moore J.MCM, LIU J.G(1990). Image enhancement of epithermal gold deposit alternation zones in southeast Spain.
Figure 1 Location map of study area
Figure 2 Colour composite of TM bands 5.3 and 1. with BCET enhancement for lithological mapping
Figure 3 Colour composite of difference bands (5-7.4-2 and 3-1) for alteration mapping
Figure 4 Hybrid colour composite of principal component 5.4 and difference (5-7), showing different altered Zones