| GISdevelopment.net ---> AARS ---> ACRS 1994 ---> Poster Session |
Estimation of Areal
Evapotranspiration Using Landsat TM Data Alone
Yongfen Wei and Kimiteru
Sado
Department of Civil Engineering, kitami Institute of Technology
Koen-cho 165, Kitami, 090 Hokkaido, Japan
AbstractDepartment of Civil Engineering, kitami Institute of Technology
Koen-cho 165, Kitami, 090 Hokkaido, Japan
The objective of this study is to investigate the possibility of using landsat TM 7 bands' data alone to estimate evapotranspiration (ET) over large areas. To achieve this purpose, various regression analyses were conducted, and the relationship between these data from satellites and the values of ET calculated from Morton or Penman equation was established. In addition, to examine the normalization of residual terms, the significance of regression analyses and the model';s linear quality, regression diagnosis was also carried out. As a result, the reliability of using only Landsat TM 7 bands' data to estimate ET over large areas was elearly demonstrated. Moreover, this study also made elear that of the totao 7 bands examined, the band 6 and 3 were most important for the estimation of ET.
Introduction
To utilize water resources more effectively, quicker and more accurate estimation of ET is considered to be very important. Methods based on micro-meteorological observations and heat balance models, or methods with the combined use of remote sensing data have been generally used for ET estimation. However, as these methods require a large number of observations and parameters, the estimation of ET over large areas is considered difficult. On the contrary, as remote sensing data can cover large areas, using these data to estimate the ET of such areas can be considered possible. In this study, the estimation of the ET over large areas by application of landsat TM data alone was tried, based on the considerastion that certain correlations exist between remote sensing data and the areal ET, and from the models established in regression analyzing, the polssibility of using Landsat TM 7 bands' data alone to estimate the areal ET was demonstrated.
Studied Areas and Estimation Methodology
1) Studied Areas
In this study, Tokoro river basin and abashiri river basin , both of which are located in the north - easterm of Hokkaido, Japan , with a length of 120 and 115 km , an area of 1930 and 1380 km2 , respectively , as well as a part of Kitmai city with an area of 114km2 located in the area of Tokoro river basin , all of which are shwon in fig.1, were used as the studied areas.
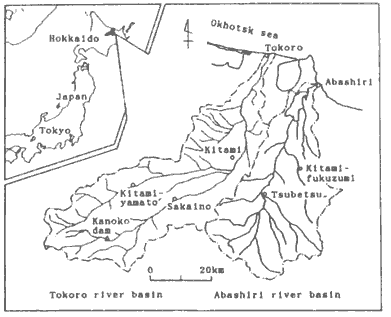
Fig 1 Studied areas
Landsat TM data of these areas collected on may 19,1989 were utilized and the corresponding land cover classifications by the supervised land classification method were conducted . The total number of pixels for Tokoro and Abashiri river basin were 34,003and 24,540 respectively , with each pixel possessing an area of 250m* 250m . For each of these river basins , eight land cover categories were obtained , with forest, grassland , plowed field , and the others including urbon area , residential area , bar ground , paddy field and water occuping 56.97 ,22.98,6.2 and 13.85% of the total area ,respectively , for Tokoro river basin and 42. 80 38.85 5.11 and 13.24% respectively, for Abashiri river basin. For Kitami city the total number o mash was 1277 (1 mesh=10x10 pixels) with each mesh having an area of 300m x 300m, and of which the ocupation of forest wasx 28.36% residential area 30.5% bare ground 15.47% the others including urban area, paddy field gressland and plowed field 26.12%.
2) Calculation of NDVI and Ground Surface Temperature
a) Calculation of NDVI : NDVI , used as an index for the evaluation of the distribution condition of the distribution condition of vegetation, was calculated by the following equation.
NDVI = (NIR-VIS) / (NIR +VIS)
In which NIR and VIS represent the CCT values in the near infrared range (band 4) and in the visible or visible red range (band 3) respectively.
b) Calculation of the ground surfacr temperature: As band 6 can detect the tempreratures, it is called as the thermal band. The temperatures in this study was calculated from the following equation proposed by K. Sado, et al. (1993) which was established according to the ground surface temperatures measured through ground truth.
H = 22 50 + 0.2643 V ……………..(1)
In which , H means the ground surfacr temperature (°C) and V the CCT value of band 6
3) Estimation of ET U sing TM data
The real ET or the potential ET calculated from Morton or Penman equation for each pixel (mesh) was used as a dependent variable and the data collected from Landsat TM as an Explanatory variable, The simple and multiple regression analyses were conducted, based on the assumption that a certain linear correlation existed between them Four models, as represented in the following are presented:
Model 1: a simple correlation between ET (E) and NDVI (N) re3presented as
E = K N + C ………………………(2)
Model 2: a simple correclation between ET and ground surface temperature (T) represented as
E1=P1T1+C1 ....................................(3)
Model 3: a multiple correlation between ET, NDVI and T represented as
E1=a1N1+b1T1+C1 ...............................(4)
Model 4: a multiple correelation between ET and all the 7 bands represented as
E1=S7n=1 Were E : the ET of each pixel (mesh) for category I calculated from Morton or Penman equation N the NDVI value ofr each pixel (mesh) belongs to category I from TM data, k and P : the regression coefficients C the constant term I the category numbeer (I=1 …8, in case of Tokoro river basin and Abashiririver basin, I = 1, …,7 in case of Kitami city) a B and a the partial regression coefficients n : the band number and B the CCT value (o 255) of each pixel (mesh) for category I and the band no n obtained from TM data.
For these abouve were tirst delermend by the least squares method. At wards, if the value of the captanatory varlable for any pixel (mesh) in a given calegory is known, the F (the estimated ET) can be calculated by these method. Howover, for the multipler regression analyses as there are many explanatory variables and some of which may be less contributory, an analysis with the backward elimination method was implemented and models presented were simplified.
Results and Discussion
1) Regression Models and the Correponding correclation cor fficents
Table 1 shows the correlation codfarents or regression andyses counducted for the above mentioned three areas where alculated from Morton equation was used as the dependent variable. As indcated for cach category. A) the correlation coefficients for model 1 (R) were very small and the correlation between ET and NDVI was not satifsfactory. This may be attributed to the consideration that the vitality of veghetation was low in May when the studies laf were collected; and b) the correclation coefficients of models 2,3, and 4 incresased gradually as the number of concerned explanatory variables increased , showing a relationship of R R R and of which the best correlation was achieved with model 4. Besides, regarding the multiple correlation coefficients of all the categories examined, an order of grassland (or for est ) water all other categories existed for both Tokoro and abshiri river basins, for Kitami city nowever, the coefficient of paddy field was the greatest
| Category | Tokoro River Basin | Abashiri River Basin | Kitami City | ||||||||||||
| Num of data | R1 | R2 | R3 | R4 | Num of data | R1 | R2 | R3 | R4 | Num of data | R1 | R2 | R3 | R4 | |
| Urban area | 87 | -0.01 | 0.19 | 0.19 | 0.35 | 242 | -0.11 | 0.17 | 0.25 | 0.42 | 843 | -0.04 | 0.17 | 0.17 | 0.27 |
| Residential Area | 1280 | 0.07 | 0.18 | 0.18 | 0.22 | 1098 | -0.26 | 0.21 | 0.28 | 0.46 | 1138 | -0.11 | 0.25 | 0.26 | 0.34 |
| Grass land | 7813 | 0.8 | 0.68 | 0.69 | 0.73 | 9553 | -0.01 | 0.76 | 0.76 | 0.81 | 364 | 0.02 | 0.20 | 0.20 | 0.23 |
| Paddy field | 113 | -0.14 | 0.48 | 0.52 | 0.56 | 218 | -0.26 | 0.13 | 0.24 | 0.51 | 226 | -0.55 | 0.42 | 0.59 | 0.63 |
| Field | 2108 | -0.02 | 0.11 | 0.11 | 0.34 | 1254 | -0.25 | 0.27 | 0.24 | 0.36 | 735 | 0.02 | 0.24 | 0.25 | 0.26 |
| Bare ground | 425 | -0.29 | 0.50 | 0.54 | 0.62 | 165 | -0.13 | 0.25 | 0.25 | 0.45 | 995 | -0.04 | 0.10 | 0.10 | 0.18 |
| Forest | 19371 | 0.12 | 0.54 | 0.71 | 0.72 | 10504 | 0.12 | 0.13 | 0.65 | 0.73 | 1070 | -0.09 | 0.34 | 0.35 | 0.39 |
| Water | 27 | 0.53 | 0.71 | 0.53 | 0.71 | 543 | -0.59 | 0.12 | 0.57 | 0.72 | 0 | ||||
| Total area | 31224 | 0.08 | 0.53 | 0. | 0.59 | 23557 | -0.04 | -0.59 | 0.67 | 0.68 | 5371 | 0.61 | -0.57 | 0.67 | 0.82 |
Based on what mentiened above it was noticed that, of all four models presented, the most satisfactory orrelation for greassland, forest and water (paddy field for Kitami city) could be achieved with the model 4.
Concerning the analyses when the potential ET calculated from Penman equation was used as the dependent variable, a similar result with only alittle difference was obtained. ?Therrefore, it might be conceivable that, the model 4 was the most reasonable one in estimatin the ET of eategories of forest, grassland and water for the river basins investigated, and the ET of paddy field for Kitami ciyt.
2) Verification of the Effectiveness of Model 4
Fig2 shows and example representing the relationship between the ET calculated from jodel 4 and the ET calculated from Morton or Penman equation for grassland, forewst and water in the area of Tokoro river basin, As shown, all the plotted data approached the 1:1 line indicating a good agreement between the ET values obtained by both these approaches, The effectiveness of using model 4 to estimate ET was celarly demonstrated.
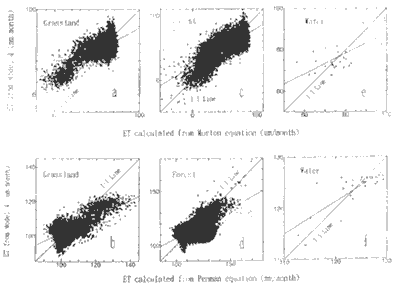
Fig 2 Relationship between the ET from Model 4 and the ET from Morton or Penman equation in the Tokoro river basin
3) Regression Diagnosis of the Established Model4
To verify the reliability of the proposed model 4, regression diagnosis concerning the following aspects was completed: a) Variare analysis
For categories of grassland, forest and water in Toloro and Abashiri river basins and paddy field in Kitami city, variance analysis was conducted and the esistence of the following relationship was verified.
In which n is the number of data p is the number of explanatory variiables and a is the significance standard (in this study a = 0.01 and 0.05 were adopted) as summarized in table 2. This meant that the regression analyses conducted were significant.
| Tokaro River Basin | Abashiri River Basin | Kitami City | |||||||
| Forest | Grassland | Water | Forest | Grassland | Water | Paddy field | |||
| Morton method | F0 | 3994.01 | 1237.37 | 5.44 | 1630.07 | 2952.84 | 90.77 | 20.68 | |
| F7 n - 8 (a) | a = 0.01 | 2.01 | 2.01 | 2.01 | 2.01 | 2.01 | 2.01 | 2.01 | |
| a = 0.05 | 2.64 | 2.64 | 2.64 | 2.64 | 2.64 | 2.64 | 2.64 | ||
| Penman Method | Fo | 3212.69 | 996.63 | 20.22 | 1682.69 | 3000.51 | 82.14 | ------ | |
| F7 n - 8 (a) | a = 0.01 | 2.01 | 2.01 | 2.01 | 2.01 | 2.01 | 2.01 | ------ | |
| a = 0.05 | 2.64 | 2.64 | 2.64 | 2.64 | 2.64 | 2.64 | ------ | ||
b) Normality analysis
The normality of residual terms in model 4 was analyzed through ?Q Q plotting (a kind ) of normal curve paper) As indicated in Fig. 3. An example for the category of water in Tokoro river basin in case of Morton equation, all the plotted points agreed well with the 1:1 line, through which, the normality of residual terms was proved.

Fig 3 Q~Q Plot for water of the Tokoro river basin
d) Correctness of the assumption of liner relation
To evaluate the correctness of the assumption that a liner relation exists between the explanatory and the dependent variables as indicated in model 4, scatter figures of the standardized residual against the ET values estimated by model 4 were drown, an example of which being shown in Fig4. As could be seen, regardless of the magnitude of estimated ET, the values of the standardized residual scattered uniformly within the range of between 2.5 and 2.0 Through this result, the correctness of the assumption made during the estabilishment of model 4 could be verified.
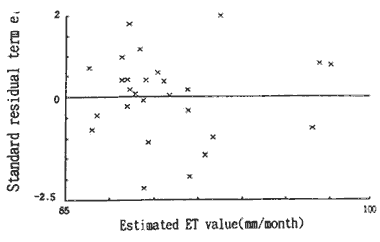
Fig 4 Scatter figure for water of the Tokoro river basin
4) Analysis of the Contribution of Each Band in ET Estimation
To evaluate the extent of contribution of each band in the estimation of ET, the partial correlation coefficients of grassland, forest and water in the two river basins were calculated and summarized. As shown in table 3, although the coefficients changed with the examined category, for both the Morton and Penman equations the absolute values of coefficients of band 6 and 3 were relatively hgih, compared to those of other bands for both grassland and forest. These results implied that, in the sestimation of ET for both grassland and forest, the contribution of band 6 and 3 was eminent, which verified the correctness of the indication that the predominant elements influencing the ET values were the grond surface temperature and the vegetation. The blank protion in the Table 3 manns that corresponding partial correelation coefficients were judged to be no signifiance after the backward elimination analysing.
| The Partial Correlation Coefficient | |||||||||||||||
| Category | Morton | Penman | |||||||||||||
| B1 | B2 | B3 | B4 | B5 | B6 | B7 | B1 | B2 | B3 | B4 | B5 | B6 | B7 | ||
| Abashiri | Grassland | 0.243 | -0.275 | -0.157 | 0.063 | 0.693 | -0.144 | -0.234 | 0.277 | 0.169 | -0.069 | -0.694 | 0.147 | ||
| River | Forest | 0.234 | 0.413 | -0.302 | -0.132 | 0.032 | 0.632 | -0.058 | -0.229 | -0.146 | -0.304 | 0.182 | -0.017 | -0.632 | 0.042 |
| Basin | Water | 0.384 | 0.303 | -0.174 | -0.459 | -0.203 | 0.260 | 0.146 | -0.372 | -0.304 | 0.192 | 0.458 | 0.155 | -0.257 | -0.133 |
| Tokoro | Grassland | 0.173 | 0.056 | -0.219 | -0.129 | 0.113 | 0.678 | -0.147 | -0.131 | -0.055 | 0.190 | 0.136 | -0.128 | -0.606 | 0.151 |
| River | Forest | 0.311 | 0.153 | -0.306 | -0.155 | 0.127 | 0.610 | -0.126 | -0.275 | -0.118 | 0.259 | 0.207 | -0.118 | -0.594 | 0.118 |
| Basin | Water | -0.418 | 0.328 | -0.438 | 0.482 | 0.381 | -0.466 | ||||||||
Besides, from this table, it was also noiced that, for bands 1 - 7 of both the river basins examined, the positive and negative of coefficients obtained through the regression analyses with Morton equation and Penman equation absolutely reversed.
The reason concerning this tendency, at the present stage, was considered to be connected to the complementary relationship as shown in Fig 5 that, relative to the change of water content in soil, an increase in the real ET was always accompanied with a decrease in the potential ET. To elucidate the occurrence of such a tendency noted in this study, further research is needed.
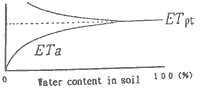
Fig 5 The complementary relationship between the real ET (ET:) and the potential ET (ET:::)
Conclusions
An estimation of the Areal ET in two river basins and one city only using Landasat TM data was tried, and the reliability of the presented models was inverstigated. The conclusions could be drawn as follows:
- Effective estimation of ET for grassland, forest, water and paddy field could be conducted by the application of Landsat TM data alone.
- Of all bands examined in model 4, the band 6 and 3 were the most predominant elements in estimating ET of gressland and forest.
- In estimating ET by using landsat TM 7 bands' data alone, the real ET and the potential ET calculated from Morton and Penman equations respectively could be used as the dependent variable, with which an apparent difference regarding the multiple correlation coefficients was not notice.
- Y. Tanka, et al. (1984): Handbook for Computerized Statistical Analysis II, Chapter of Multi variable Analysis, Kyourtu press.
- K. Sado, T. Tanishima, T. Nakao and H. Mori (1993): heat Relaxation by Vegetation an River Water of Four cities in Eastern Hokkaido Using Landsat/TM Data, proc. Of Hokkaido Branch Conference of JSCE ppl. 559-564
- K. Otsuki, et al. (1989) : Evapotranspiration (VII)- Areal Evapotranspiration J. of Jap Soc. Of Irrigation Drainage and Reclamation Eng. Vol 57 No. 10 pp 133 -139
- Y.F. Wei, K. Sado and T. Nakao (1994): Estimation of ?Evapotranspiration in Large Areas Using Normalized Vegetation Index and Ground Surface Temperature proc . Of Hokkaido Baranch Conference of JSCE, pp. 366-369.
- Y.F. Wei and K Sado (1994) : Estimation of Areal Evapotranspiration with Multiple Regression Models only Using Landsat tM Data, Proc of 1994 Annual Conference. Japan Society of hydrology and Water Resources pp 74-75.
- Y.F. Wei and K Sado (1994) : Estimation of Evapotranspiration over Large Areas using Landsat TM Data, proc of National Conference of JSCE.
- K. Sado (1993) : Effect of land cover on River Basin Evapotranspiration Using Landsat TM Data the Case of Tokoro River Basin, hokkaido, Japan, Proc of The 14th Asian Conference on Remote Sensing (Iran), pp. B-3-1-3-6