| GISdevelopment.net ---> AARS ---> ACRS 1994 ---> Disasters |
Land Degradation Analysis of
Rainfed Agricultural Area in Pakistan using Remote Sensing Data
Satoshi Uchida*, Rakhshan
Roohi** and Shahid Ahmad**
* Japan International Research Center for Agricultural Sciences (JIRCAS)
1-2 Ohwashi, Tsuuba, Ibaraki 305, Japan
** National Agricultural Research Centre , Pakistan Agricultural Research Council
P.O. Box BIH, Park Road, Islamabad, Pakistan
Abstract* Japan International Research Center for Agricultural Sciences (JIRCAS)
1-2 Ohwashi, Tsuuba, Ibaraki 305, Japan
** National Agricultural Research Centre , Pakistan Agricultural Research Council
P.O. Box BIH, Park Road, Islamabad, Pakistan
Pothwar plateau area located in the northern part of Punjab province in Pakistan which is characterized by a high but irregular amount of precipitation has been developed as rainfed agricultural land mainly for wheat cultivation. This area I mostly covered with loess soil which is highly erosive. The objective of this study is to evaluate the capability of satellite remote sensing data for delineating erosive conditions and associated land degradation. Satellite data with three different scales have been employed for this study. GVI data were used to describe the general vegetation conditions of the area SPOT panchromatic data were mainly used to extract the severely eroded areas and LANDSAT TM data were used to calculate indices of soil and vegetation conditions. The conclusions of this multi-staged approach were as follows; 1) GVI data can be applied to distinguish agricultural land from non-agricultural land, 2) severely eroded area can be extracted by digital image processing from SPOT panchromatic data,3) land coverage and soil conditions in severely eroded area can be characterized by some indices calculated from LANDSAT TM data.
1. Introduction
Agricultural lands have been degraded by imppropriate use and management of limited land resources. In the pothwar plateau located in the northern part of Punjabprovince in Pakistan, rainfed agricultural land which is used mainly for wheat cultivation in the Rabi season has covered a considerable area of potentially arable land. The natural conditions of this land may be suitable for crop production provided that rainfall is stable and soil erosion is well controlled. However irregular climatic conditions for a long period of time and inadequate land land management in addition to the existence of highly erosive soils have resulted in the expansion of severely eroded and degraded land in this area.In order to conserve land and imporve degraded ranges, it is necessary to analyze the land conditions and the cause of land degration. For this purpose it is considered that the use of remote sensing and a geographic information system would provide information about ground features.National Agricultural Research Centre (NARC) of Pakistan Agricultural Research Centre (NARC) of Pakistan Agricultural Research Council and JIRCAS started a collaborative research program entitled ''Dynamic behavior of soil erosion/degradation and development of techniques for prevention of erosion in all tropical land uses' in 1991. This paper is a part of the results on the applicability of remote sensing technology to land degradation analysis . This study also takes into consideration the effect of a multi-staged approach using remote sensing data.
2. Objectives
There are three major objective in this study. The first one is to characterize the regional features in terms of vegetation veriation using remote sensing data with relatively low spatial resolution. The second is to delineate the complex topographic patterns in severely eroded areas by analyzing the data with high spatial resolution. And the last one is o distinguish the relation between erosivity and ground surface conditions associated with vegetation , soil and coverage state using multi-spectral information .
3. Study Area
Geographically the pothwar plateau is located on the watershed of the Soan river, which is one of the main tributaries of the Indus river, and its adjoining hilly areas. The elevation of this area ranges between 300 and 500 meters above sea level and the amount of mean annual precipitation varies from about 500 to 1,000 millimeters. There are two peaks of rainfall in a year one in February to March and the second in July to August Crop cultivation usually corresponds to the rainfall pattern and the cropping season from October to March is called Rabi and the other season Kharif. The major soil types are loamy eroded loess and shallow residual with some gullied land Land use type is largely for agricultural purposes without systematic irrigation systems and the intensity of cultivation is relatively low.The scale of the study area foe data processing varies with the objectives. The target area for studies on vegetation variation using data with low spatial resolution was originally the whole country. Thereafter characteristic areas inside the Pothwar plateau were selected. With relatively higher resolution date, the calculated range which should be located in the middle of the Pothwar plateau includes 2,500 lines by 3,300 columns for SPOT data and 750 lines by 1,000 columns for LANDSAT data, respectively.
4. Methods
In this study basic data consist of satellite remote sensing data with three different scales and several kinds of small scale thematic maps. The satellite data with the smallest scale correspond to GVI (Global Vegetation Index) of which the original sensor is NOAA-AVHRR and the mesh size is modified to a larger value to cover the whole surface of the earth in a unit data set. Although GVI data represent weekly normalized vegetation index values, monthly maximum values in 1986 to 1989 have been applied to this study. Tow other satellite data consist of LANDSAT TM and APOST HRV panchromatic data. The data obtained by these satellites were recorded on 9 February 1992 and 2 April 1990 , respectively. Thematic maps are a part of intermediate archives of the agroenvironmental atlas produced by NARC and the scale of the sheet is 13,000,000.
Although seasonal variations of the vegetation are different from area to area, it is assumed that the vegetation state within an area with homogenrous physical and land use conditions may be uniform in general. In this case therefore, unit district of land which is applied to calculate the average value of GVI data is defined by overlaying six subjects of thematic maps as shown in Figure 1.0.02 degree in both latitude and logitude in order to match the position with that of land unit.
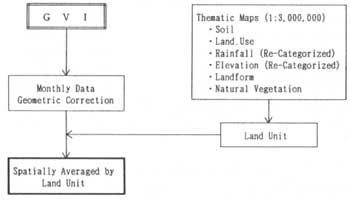
Figure 1. Flow of GVI data analysis
Extraction of severely eroded area is performed by using SPOT data and its procedure is illustrated in the upper part of Figure2. Two different methods were applied to this purpose. One was the manual interpretation method which distinguished the severely eroded area of the imagery other was the extraction by a digital image processing of data. For the purpose of facilitating extraction, effects of high path filter and rank order filter were examined in the process shown in figure 2.

Figure 2. Flow of Soil erosion area analysis
The lower part of Figure 2 illustrates the observation of distributional characteristics of several kinds of indices derived from LANDSAT TM data. Soil Moisture Index (SMI) and Normalized Vegetation Index (NVI) are both calculated from from band 2 and 4 data. For the calculation of NVI, the minimum value appearing in the histogram would be subtracted from the data of each band to correct simply rediometric bias associated with component of principal component analysis for the two dimensional data (band 3 band 4 ) provided that the NVI value ranges between o and o.2 because SMI is not effective in areas densely covered with vegetation . Coverage Index (PDRG) is a modification from the index PD54 developed by Pickup et al. (1993) in which the original concept was applied to band 4 and band 5 of LANDSAT MSS data Another information is a subtracted value of normalized SPOT data . Although the observation time varies with the years, seasonal allocation which is presented on the opposite side of the peak of vegetation activity in the Rabi season may enable to distinguish some interesting features of the regional engironment.
5. Results and Discussion
1) Analysis of vegetation changes using GVI data
By overlaying six thematic maps tow land units dominated the area of the Pothwar plateau. The conditions between the two units differed only in the pattern of precipitation, with more than 250 millimeters in both Rabi and Kharif seasons for one and more than 250 millimeters in Kharif but less than 250 millimeters in Rabi season for the other.
Figure 3. Change of GVI in the Pothwar plateau (low rainfall)
Figure 3 shows the changes of GVI in the land unit with relatively less precipition and Figure 4 shown the changes for the unit with higher precipitation . It was indicated that the condition could be fulfilled only if the GVI data in a temporal and spatial range were representative (Goward et al. (1993)). Procedure for spatial averaging in this study could mitigate the sause of error in the analysis , so that these figures indicate two distination maxima corresponding to Rabi and Kahrif crop cultivation and extremely low values between maxima where the climate is hot and dry. GVI values at maxima are evidently higher in the unit with higher precipitation and the presence of a peak is unstable in the Kharif season in both units . Especially no distinctive Kharif peak was noticed in 1987 owing to the shortage of precipitation .
Figure 4. Change of GVI in the Pothwar plateau (high rainfall)
Similar changes in the pattern of GVI, that is the presence of two maxiam, were observed in the irrigation agricultural areas. On the other hand no depression of change in the pattern in summer season was observed the wood and forest areas and the same in rangland These findings support that it is possible to distinguiest agricultural lands from other land uses by analyzing the temporal changes of GVI data. Figure 5 shows an attempt to differentiate agricultural lands from non-agricultural lands, where the horizontal axis denotes themaximum value in February to April and August to October and the vertical exis denotes the minimum value in May to July. A small number of exceptions can be seen for degraded land where vegetation after rainfall grow under susally and conditons. The figure shows that the largest number dosts representing non-agricultural lands would be allocated along a line according to their averaged vegetation activities and those of agricultural lands would be distant from the lone.
2). Extraction of severely eroded area using SPOT data
Soil erosion in the Pothwar lateau is characterized by the development of dissected valleys since the widely distributed locess soil is highly erodibel by water in the vertical direction . These valleys appear ;on the satellite imagery with high frequency features when the spatial resolution of the imagery corresponds to the scale of topographic variations . Figure 6 compares two satellite imagerics of the area including a severely eroded area . SPOT panchromatic mode with 10 meter spatial resolution shows clearly the dissected patterns by soil erossion located in the upper left and upper right sides of the imagery. The portions occurring with a high frequency but relatively regular pattern represented on the lower side probably correspond to arable land. Comparison of the SPOT imagery with LANDSAT TM (band2) shows that the former is evidently superior to the latter for delineating eroded areas.Land features occurring with a high frequency can be expressed by applying statistical data analysis. Auto-correlation function is one of the methods which represent spectral characteristics of objects . Pickup and Chewings (1988) applied this technique to the temporal change of land degradation induced by soil erosion. In this study auto-correlation functions have been differences the high path filtering with 3X3 window images Figure 7 shows the results of calculation of the whole target area and Figure 8

Figure 5. Scattergram of seasonal GVI by land unit
shows the results for the severely eroded area. The effect of a high path filter on the decrease of the correlation between Pixels in a certain distance is evident and the correlation values of high path filtering for the severely eroded area become less than 0.5 where inter-Pixels distance is more than three pixels From the results mentioned above the variance of brightness with a small number of pixels may become an indicator of the intensity of erosion . Hence the calculation of the standard deviation of brightness within a 3X3 window was performed in this study. The results showed a high value at the boundary of man-made constructions such as roads and buildings. Therefore in order to remove these misleading parts the applicability of rank order filter within a 5x5 window to calculate the value was examined .
Figure 6. Comparision SPOT panchromatic and LANDSAT TM unages if eroded area
Figure 7. Auto correlation curve for whole area

Figure 8. Auto correlation curve for eroded area

Figure 9. Separation of eroded area by rank order filter

Figure 10. Comparison of estimated erodibility between eroded areas with different severity
Figure 9 shows that calculated value in the eroded area could be separated from that in the non-eroded area according to the formula described in the figure . From this figure it is evident that rank order filter is more superior to average or median (rank order = 13) filter to distinguish an eroded area from a non- eroded area. This figure also indicates that the best selection of rank order for high path filtered data is three if the weighing of filter center is 12. Figure 10 illustrates the cumulative percentage of calculated values which are used as the optimum selected variables for two areas with different conditions. This result shows that calculated values between two areas enable a seperation and suggests that the extraction of a severely eroded area by digital processing of remote sensing data would be possible.
3). Relation between erosivity and ground surface conditions
Soil erosion observed in the present state results from sequential interaction at the ground surface over a long period of time. On the other hand satellite remote sensing data represent an instantaneous state of surface at the moment of observation. Rao et al. (1991) summarized the concept of application of remote sensing techniques to soil erosion studies and suggested that the tendency of soil erodibility could be estimated by remot sensing data. Hence this study should recognize the land use state of the study area in general and temporal change of the surface condition in association with human activities.
Comparison of the histogram of calculated index value between a severel eroded area and less eroded area indicates that both NVI and PDRG show distinct differences while SMI shows a negligible difference. Generally speaking severely eroded area ia not suitable for agricultural land use unless land consolidation by appropriate measures is performed . Therefore eroded area is prone to become wasteland where vegetation coverage does not develop densely. The distribution of SMI is considered to be depend on some local factors such as the presence of transitory water supply or inundation and it would be difficult to predict the location of these occurrences.
Table 1. Correlation matrix of indices for severely eroded area
| NVI | PDRG | SMI | B3+B3 | SPTN | TM-SP | EREST | |
| NVI | 1 | 0.671 | -0.128 | -0.577 | -0.418 | -0.126 | -0.087 |
| PDRG | 1 | -0.752 | -0.914 | -0.511 | -0.361 | -0.075 | |
| SMI | 1 | 0.851 | 0.410 | 0.408 | 0.035 | ||
| B2+B3 | 1 | 0.531 | 0.426 | 0.090 | |||
| SPTN | 1 | -0.540 | 0.281 | ||||
| TM-SP | 1 | -0.210 | |||||
| EREST | 1 |
| NVI: Normalized Vegetation
Index PDRG: Coverage Index by Band2 & Band3 SMI: Soil Moisure Index B2+B3: Band2+Band3, Normalized |
SPTN: SPOT-P, Normalized TM-SP: Difference of (B2+B3) from SPTN EREST: Estimated Erodibility (Rank Order 3) |
Table 2. Correlation matrix of indices for less erded area
| NVI | PSRG | SMI | B2+B3 | SPTN | TM-SP | EREST | |
| NVI | 1 | 0.748 | -0.079 | -0.679 | -0.481 | -0.260 | -0.264 |
| PDRG | 1 | -0.604 | -0.931 | -0.623 | -0.397 | -0.372 | |
| SMI | 1 | 0.770 | 0.381 | 0.479 | 0.205 | ||
| B2+B3 | 1 | 0.623 | 0.478 | 0.387 | |||
| SPTN | 1 | -0.388 | 0.593 | ||||
| TM-SP | 1 | -0.210 | |||||
| EREST | 1 |
| NVI: Normalized Vegetation
Index PDRG: Coverage Index by Band2 & Band3 SMI: Soil Moisure Index B2+B3: Band2+Band3, Normalized |
SPTN: SPOT-P, Normalized TM-SP: Difference of (B2+B3) from SPTN EREST: Estimated Erodibility (Rank Order 3) |
Table 1 and Table 2 show the correlation matrix of indices derived from remote sensing data for a severely eroded area and a less eroded area, respectively, where EREST is the same as the calculated texture value shown in Figure 10. There is a major difference in the correlation value between the two tables in the column of EREST. In Table 1 there is almost no correlation between EREST and the indices derived from LANDSAT data, whereas in Table 2 some correlation can be recognized. These results may be ascribed to the presence of mna-made constructions in which the spatial change of the rate of brightness is large and forested area of which the reflectivity in the visible range is relatively low in the less eroded area.
Conclusions
This study aimed at the development of a method of analysis of remote sensing data for specified environmental problems as well as unique case study . Soil erosion and its associated alnd degradation are ubiquitous phenomena and must be categorized into typical patterns. In the Pothwar plateau water erosion is considerable and dissected valleys develop since the climate is semi-arid and land use type is mostly rainfed agricultural land.. These features can be characterized by using an appropriate sensor of satellite data.
For the purpose of describing a regional averaged pattern of vegetation change, GVI data were effective although they may bot by representative of spatial conditions enable to distinguish agricultural land from non-agricultural land. These data also indicated that vegetation activityof cultivated land in a specific year is extramely low compared with normal year due to climate abnormalities.To extract a severely eroded area in a relativelyarge scale imagery, SPOT panchromatic data could be used for an area where the scale of typical spatial variation is the order of ten meters Digital image processing as well as manual interpretation could be applied to the estimation of erodibility of land provided the suitable measures of pre-processing such as high path filter and rank order filter were used.