| GISdevelopment.net ---> AARS ---> ACRS 1994 ---> Disasters |
Tropical Cyclone Monitoring
using INSAT, ERS-1, NOAA and DMSP Satellites
B. M. Rao, M. S. Narayanan,
C. M. Kishtawal, P. K. Pal
Meterology and Oceanography Division,
Space Applications Centre (SIRO).
Ahmedabad - 380 053, India
V. S. Prasad, A. N. Nath, K. H. Rao, M. V. Rao
National Remote Sensing Agency, Hyderabad
S. K. Subramanyam
India Meteorological Department, Madras
AbstractMeterology and Oceanography Division,
Space Applications Centre (SIRO).
Ahmedabad - 380 053, India
V. S. Prasad, A. N. Nath, K. H. Rao, M. V. Rao
National Remote Sensing Agency, Hyderabad
S. K. Subramanyam
India Meteorological Department, Madras
The 80-100 topical cyclones that occur each year affects many counties around the globe and exacts tremendous annual losses in life and property. Seatellites are uniquely suited to the task of tropical cyclone surveillnace. Recent observational studies uing extensive satellite data to supplement conventional surface and upper air data have revealed the structure of tropical cyclones. An attempt has been made here to demonstrate the multi-sensor approach based on VHRR data from INSAT, Microwave sounder data from NOAA, ERS-1 scatterometer derived surface wind vectors and rain rate measurements from SSM/I in the diagnosis of tropical cyclones in the Indian region.
1.0 Introduction
Tropical cyclone ranks with earthquakes as the major geophysical causes of loss of life and property. A tropical cyclone is a warm-core low-pressue system that develops over the warm tropical oceans in association with an upper-level anticyclone, with intense winds moving anticlockwise (clockwise) in the northern hemisphere (southern hemisphere) around its clear, calm eye region. After crossing the land they cause destruction in the coastal areas because of the storm surge (rise in sea level inundating coastal areas), strong winds and heavy and widespread rainfall causing floods. All over the world increasing attention is being paid to the understanding of the mechanism of formation, development, structure and movement of these cyclones.
During the last few years a number of polar and geostationary satellites carrying a sophisticated array of instruments making measurements in the various regions of electromagnetic spectrum have provided valuable quantitative information about the cyclones. Geostationary satellite INSAT with a Very High Resolution Radiometer (VHRR) onboard provides visible and infrared pictures once in 30 minutes These are operationally used for locating the centre of the cyclone as well as to estimate the current intensity of the storm. NOAA series of satellites with a sounder facilitates the retrieval of atmospheric temperature profile even in the cloudy conditions. Unpprecedeted views of surface wind fields in tropical cyclone are now provided by the 5.3 GHz scatterometer on the ERS-1 satellite. Similarly SSM/I observations from DMSP satellite provide information on the convection and instantaneous rain rate in the cyclones.
An attempt has been made here to demonstrate the usefulness of this multi-satellite multi-sensor approach in the diagnosis of the tropical cyclones in the India region. One of the major drawbacks of tropical cyclone research with extensive satellite data has been the lack of high quality data sets to verity the satellite diagnosis. A concerted effort is required to organize aircraft reconnaissance flights over the Indian region to provide high quality data sets which would go a long way in improving the understanding of these recurring devastating atmospheric phenomena.
2.0 Surface wind observations using ERS-1 Satellite
European Remote Sensing Satellite (ERS-1) launched in 1991, with an onboard 5.3 GHz Scatterometer, provides surface wind fields, which is one of the most important parameters along with surface heat fluexes in the feed back mechanism driving tropical cyclones. A number of cyclones in the Indian region sicne 1991 with ERS-1 coverage have been analysed to study different aspects of cyclones particularly the evolution of rotating wins. Here we present two typical cases of scatteroomter-derived surface wind fields beneath the cyclones.
Fig. 1 (a) shows the surfae winds (fast deliver product from ESA) asociated with the cyclne in the Bay of Bengal on November 19,1992. On this day the cyclonic storm had attained the hurricane intensity and was located at 11.5° N and 880 E. The ERS-1 sub satelite track was passing almost over the centre of the cyclone.
Figure 1 ERS-1 Scatterometer derived Surface wind field over the Bay of Bengal cyclone on November 19, 1992.
Although the spiraling flow is quite evident from fig.1 (a) , a close inspection reveals that from most of the vectors the ambguity in the seen to be out of phase by 1800 Attema (1993) has also reported a similar directional ambiguity in the case of typhoon Elsie south of Japan. The wind vectors have been corrected under the assumption of the cyclonic flow around the known centre of the cyclone. The corrected wind field (fig. 1 b) depicts the typical surface gradients in the wind speed with low wind speeds in the calm eye region of the cyclone and highest wind speeds just 10-20 km away from the centre are clearly see. In general the wind speeds ranged bewteen 5 and 8 ms-1 in the outhe region, whereas the maximum wind speeds in the range o 22-25 ms-1 in the eyewall region are seen. On this day (November 19,1992) the intensity of the cyclone as inferred from the INSAT-VHRR imagery was T-5.5 on the Dovrak's T-number scale (Dvorak, 1975). Using the empirical relation for Bay of Bengal, this T- number corresponds to a maximum wind speed of around 50 ms-1, whereas the ERS-1 Scatterometer estimates are around 25 ms-1. Obviously, the high wind speeds associated with the tropical cyclones are highly smoothed in ERS observations. Similar features were noticed in the case of Arabian Sea cyclone on November 14, 1993 (fig.2)
Figure 2 Same as fig 1 except for the Arabian Sea cyclone on November 14, 1993.
Quilfen et al (1993) have analysed the scatterometer surface wind fields of a number of hurricanes and have listed the main reasons for the shortcomings as (I) the inadequac of the C-band model function for high wind speed conditions (ii) coarser spatial resolution (50 m) of the scatterometer and (iii) the attenuation of the radar signals by the intervening atmosphere.
Under the assumption of circular symmetry in the core of the cyclone during its intense stage, a novel method has been developed (Rao et 1l, 1994) for estmating the centre of the cyclone based on the scatterometer winds. Isotaches> 14 m/s were found useful in estimating the centre accurately. Centre computations were made on isotachs from 14 to 20 m/s. The rms error of the centre determined by this method in the case of Bay cyclone on November 19,1992 was less than 20 km, which is bette than that from current methods of estimating the centre, employing satellite visible imagery. The accurate determination of the centre of the cyclone using scatterometer-winds has been found useful in the track prediction, particularly in the case of a recurving cyclone (Kishtwal et al, 1994).
3.0 Warm core observations of tropical cyclones using NOAA microwave data.
Kidder et al (1978) and Velden and Smith (1983) have documented the existence of an upper level warm core in tropical cyclones. This warm temperature anomaly is the result of latent heat being released in the stron convective regoions of the storm, supplemented by adiabtic warming due to subsidence in the eye region as the storm develops. Passive microwave data from NOAA satellites have the ability to penetrate cloudy regions associated with tropical cyclones and delineate the thermal anomalies that exist. Assuming the cyclone to be in hydrostatic balance, a relationship between the intnsity of this upper level (250 mb) warm temperature anomaly and the central surface pressure of the storm can be obtained.
NOAA series of satellites carry a TIROS Operational Vertical Sounder (TOVS) onboard, which includes a Microwave Sounding Unit (MSU), MSU operates in the oxygen absorption bands at 50.31, 53.73, 54.96 and 57.05 GHz and enables derivation of atmospheric temperature profiles. These frequency channels each have a broad weighting function which peak at surface and around 600, 300 and 60 mb levels respectively. The spatial resolution of MSU observations is 110 X110 km at nadir.
NOAA-MSU data pertaining to two cyclones during November 18-19,1992 and May 6-9,1990 were processed on the METDPS system at NRSA, Hyderabad. Vertial profiles of atmospheric temperatures derived from radiances sensed by MSU are used to depict upper tropospheric warm anomalies associated with these two storm. Fig. 3 shows the horizontal distribution of temperatures over the cyclone area at 250 mb level on May 7,1990 The temperaturs very close to the eye of the cyclone are around -350C (core sounding), cyclone (-7-8 degrees away from the centre enironmental soundings) range between -38 to 410C. Average of about 10 environmental soundings are taken into consideration.
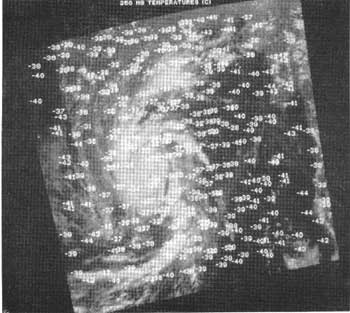
Figure 3. 250 mb temperature distribution over the cyclone in the Bay of Bangal on May 7, 1990
The core temperature minus the average environmental temperature can be termed as the gradient of the 250 mb temperature fields (T). In the present case it is of the order of 4.5 deg. C. Due to the resolution limitations (110 km at nadir), the MSU observations cannot fully resolve the actual magnitude of the warm anomalies. Thus, the satellite-depicted anomalies are a volumetrically averaged representation of the true tropical cyclone anomalies. Similar observations of warm lemperature anomalies and ther relationships with the surface intensity on the storms in Altantic and Pacific have been reported by Velden el al (1991) and Velden (1989).
Efforts are underway to relate the T observations with intensity parameters of the cyclones over the Indian region. Nevertheless, as a first guess, we have used the relationships given by Velden (1989) for the Atlantic region and related the T as observed on May 7,1990 using MSU data to obtain P and maximum wind estimates. The maximum winds range between 130 and 160 kts while P ranges between 70 and 90 mb. As per the analysis based on INSAT imagery, the cyclone had attained the intensity of T=6.0 on the Dvorak scale corresponding to maximum winds of 115 kts and P of 65 mb. Thus a large discrepancy is seen between these tow estimates, emphasising a need for improved relationship for the Indian region. Perhaps a combnation of T-no. and the warm core anomaly may be used as the measure of the intensity of the storm.
4.0 Precipition characteristics of troprical cyclones from SSM/I
The interaction and maintenance of a mature tropical cyclone is depenndent on the amount and distribution of rain within the inner core region of the tropical cyclone (Weatherford, 1987).
The Special Sensor/Imager onboard the US Defense Meterological Satellite Program (DNSP) provide measurements of reflected and emitted microwave radiation at frequencies 19.4, 22.2, 37.0 and 85.5 GHz. All these channels are dual polarized except the 22.2 GHz which provides polarizaion only in the vertical.
Adler et al (1993), Alliss et al (1992) have documented the SSM/I observatons related to hurricanes. Their results indicate that SSM/I measurementes can identify rain areas. In addition the relative contribution of the heavier rainfall rates (>5mm hr-1) to the tropical cyclone rainfall increased as the tropical cyclone became more intense.
We have adoted the rainfall alogrithm of Holliinger (1991), according to which rainfall over the oceans is given by
R = exp (5.10196-0.05378 T + 0.02766 T 0.01373T )-2.0
whereas rainfall rate over land is given by
R = exp (-17.7 76849-0.09612T + 0.15678 T)-1.0
where R is rainfal rate (mm h-1) and T's are brightness temperatures.
Fig. 4 shows the distribution of rainfall rates associated with the cyclone on November 18,1992. In general the rain rates varied between 2 and 8 mm h-1. The concentration of heavier rain rates near the cyclone centre and in the rain bands is seen. Further analysis is in the rain bands is seen. Further analysis is in progress to compute the Latent Heat Release (LHR) in these cyclones and to relate these changes in LHR with the subsequent intensit changes as the cyclones become more intense. The SSM/I rain rate estimates are being compared with estimates based on the concurrent INSAT VIS/IR data.
Figure 4 SSM/I derived rain rates on November 18, 1992. Noate the white area near the centre of the cyclone showing highest rain rates.
5. Conclusions
A multisensor approach has been adopted to study the various aspects of tropical cclones in the Indian region. The ERS-1 Scatterometer provides high resolution high density observations of surface wind fields associated with the cyclones. These have been found useful in the determination of the cyclone centre and in combination with INSAT data the other cyclone parameters e.g. the radius of maximum wind, R. The NOAA-MSU observations of upper tropospheric warm temperature anomalies (at 250 mb) can be used as the intensity parameter and would provide an objective method for estimating the intensity. Similarly, the SSM/I measurements have been used to study the precipitation characteristics (and thus LHR) of the cyclones. All these satellite observations, now available operationally would aid in the diagnosis of these devastating storms. Although all these observations were not available for the same cyclone, the potential of these have been explored in this investigation.
References
- Adler, R.F. A.J. Negri, P.R. Keehn, I.M. Hakkarinen, 1993, J. Appl. Meteor., 32,335-356.
- Alliss, R.J., S. Raman, and S.W. Chang, 1992, Mon. Wea. Rev., 120,2723-2737.
- Attema, E., 1993, Earth Observation Quarterly, (ESA Publications), Noordwijk, 40, 5-7.
- Dvorak, V.F., 1975, Mon. Wea. Rev., 103, 420-430
- Hollinger, J.P. 1991, DMSP SSM/I calibratin validation. Fainal Report, Vol. II 106 pp, Naval Research Laboratory, Washington.
- Kidder, S.Q., W.M. Gray and T.H. Vonder Haar, 19978, Mon. Wea. Rev., 106,1458-1464.
- Kishtawal, C.M., B.M. Rao, P.K. Pal and M.S. Narayanan, 1994, Proc. Second Symp. Space at the service of our environments, Hamburg, Germany, 11-14 October 1993. ESA SP-361 (Nanuary 1994), 117-1131.
- Quilfen, Y., K. B. Katsaros, B. Chapron, 1993, Proc. Second Symp. Space at the Service of our environment, Hamburg, Germany, 11-14 October 1993., 117-1122.
- Rao, B.Mb., C.M. Kishatawal, P.K. Pal and M.S. Narayanan, 1994, Accepted for Publication in Ind. J. Remote Sensing (UK)
- Velden, C.S., 1989, J. Appl. Meteor, 28, 59-70.
- Velden, C.S. and W.L. Smith, 1983, J. Climate Appl. Meteo., 22 714-724.
- Veldern, C.S., B.M. Goodeman and R.T. Merrill, 1991, Mon. Wea. Rev, 119, 159-168.