| GISdevelopment.net ---> AARS ---> ACRS 1994 ---> Agriculture / Soil |
Corp Discriminational in Salt
Affected Soils by Satellite Remote Sensing
R.K. Sharma, K S Sundara Sarma and D K Das
Division of Agricultural Physics,
Indian Agricultural Research Intitute,
New Delhi-110 012, India
R.K. Sharma, K S Sundara Sarma and D K Das
Division of Agricultural Physics,
Indian Agricultural Research Intitute,
New Delhi-110 012, India
Abstract
Crop discrimination is a basic requirement for acreage estimation and yield prediction by satellite remote sensing. In salt differences in reflectance caused by salt encrustation as well as retarded crop growth due to salinity. Studies were carried out in sultanpur (Gurgaon, Haryana, India) to find our the utility of IRS I LISS II satellite data in delineation of salt affected soils, differentiation of crops grown in these soils and the effect of various soul and management factors on crop growth.
Delineation of the saline and sodic soils could be achieved by Maximum likelihood classification (MXL) of IRS LISS II data obtained for saline souls were differentiated from normal soils are devoid of vegetation. The sodic and saline soils were, differentiated from normal soils with an overall accuracy of 78.2%. Under cropped conditions, during January, the MXL classifier could differentiate wheat, mustard, tree plantation and waste lands with classification accuracies of 74, 68.7, 87.1 and 97.0, respectively. Inclusion of additional classes viz., early and late sown wheat irrigate and unirrigated mustard improved the classification accuracies of wheat and mustard to 77.2 and 81.2%. The attributed to the poor growth of wheat and mustard due to salinity, irrigation and varying dates of sowing. These factors could explain 81% of the variability in Normalized vegetation index values (NDVI) under wheat cropped conditions. With regard to mustard salinity is the major contributor to the differences in NDVI.
Introduction
A major application of satellite remote sensing in agriculture is the identification of crops for acreage estimation and yield prediction. While discrimination and area estimation of crops growing in normal soils have been operationalized (Navalgund 1991), in salt affected souls the differences in reflectance due to salt encrustation as well as the retarded crop growth due o salinity make crop discrimination a difficult task.
The differences in the geometry and growth habits of plant types are manifested in their spectral responses which are used to discriminate various vegetation types. Single date satellite data (Dadhwal and Parihar 1985) as well as spectral temporal vegetation profiles (Badhwar et al. 1982) are used to discriminate various crops. However, the latter method is cost prohibitive and availability of cloud free satellite data on consecutive satellite passes is a limiting factor. Soil background (Major et al. 1990) is one of the most important factor interfering multispectral classification of crops through remote sensing, this is especially important in salt affected soils where crop growth is adversely affected due to salinity.
Landsat data have been used (Singha and Dwivedi 1989 and Saha et al. 1990) for delineation of salt affected soils. Recently, Gore and Bhagat (1991) delineated salt affected soils using IRS data. The present investigations were carried out to study the utility of IRS digital data for delineation of salt affected soils, differentiation of crops grown under salt affected soil conditions and effect of soil and management factors on spectral vegetation index of crops.
Materials and Methods
The study area belong to Sultanpur village of Grugaon District, Haryana State, India for which IRS-IA LISS-II scenes for the months of June 1990 and January 1991 were procured. A base map of 1:7250 scale was prepared from the cadastral map for ground truth data representation. Intensive soil sampling (120m x 125m grid) was done for the characterization of area for salinity/sodicity. By making use of spatial statistics the point data for electrical conductivity and pH were krigged for the preparation of thematic maps to be used in the GIS. Various crops, tree plantation, wastelands and area used for other purposes were carefully recorded in the base map. Information with regard to soil, water and crop management aspects like soil water transmission parameter, a, crop variety, date of sowing kind and time of fertilizer application number of irrigations applied, date of harvesting and yields etc. was also obtained. This information was digitized and converted to IDRISTI is a raster based GIS software with image analysis capability.
The IRS LISS II satellite data were analyzed on IBM PC/AT using IDRSI software. After registering satellite images to the ground truth maps, training sites were selected. These sites were used to generate signatures of various soil types and land use/land cover classes which were used in the supervised maximum likelihood classification algorithm for classifying the study area. For soil type differentiation the June 90 imageries were used, when the vegetation was sparse and for crop differentiation studies, January 91 period images, when the crop was at its peak vegetative growth, were used.
Results and Discussion
Delineation of Salt Affected Soils and Crop Discrimination : In the present study the saline and sodic soils could be classified with a reasonable degree of accuracy (84.5% and 80.4%, respectively). In case of saline soils, the commission errors were from both normal and sodic soils while the omissions were commissioned mainly to the sodic soils category. So, there was more commission errors (83.5%) than omission errors (15.5%) in case of saline soils. In sodic soils commission errors were relatively lower (38.97%), while the omission errors (19.61%) were slightly higher compared to saline soils (Plate 1).
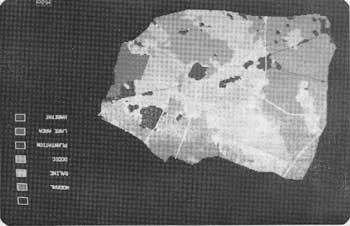
Plate 1 Soil Map of Sultanpur, Gurgaon. (Haryana) Maximumlikelyhood Classification of IRS 1A - LISS II
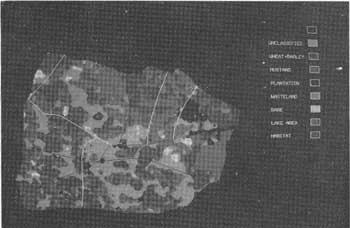
Plate 2 Land Cover Map of Sultanpur, Gurgaon. (Haryana) Maximumlikelyhood Classification of IRS 1A - LISS II
Table - 1 : Confusion Matrix for Land cover classification
Basic data : all four bands of IRS-IA LISS II for January
Classification method : Maximum likelihood classifier
(One class each for wheat and Mustard crops)
Table 2: Confusion Matrix for Land cover classification
Basic Data: All four bands of IRS-IA LISS-II for January
Classification Methods : Maximum Likelihood classifier
(Two sub classes each for wheat and Mustard corps)
Table 3. Stepwise regression analysis of soil and Management Factors with normalized Difference vegetation Index fro Wheat and Mustard.
With too many spectrally inseparable classes, the classification accuracies may generally be lower. In such cases it becomes necessary to reduce the number of classes. When the number of land cover types were reduced, the classification accuracy was found to increase (Jewell 1989). In the present case, when the saline and sodic soils were clubbed together so as to be differentiated from normal soils, the classification accuracy has gone up to 94.5%.
The signatures for wheat and barley were almost similar and these two crops could not spectrally separated out. Earlier, Dawbin and Evans (1988) has suggested grouping of wheat and barely crop into one category due to overlapping crop calendars and similar agronomic characteristics in NSW, Australia. So, these two crops were clubbed together as wheat, and the class statistics were recalculated. Using these class statistics and maximum likelihood alogorithm, the area was classified into different landuse.land cover types.
The results indicated classification accuracies of the order of 74.7% for wheat and 62.7% for mustard crops. tree plantations gave a classification accuracy of 87.1% while maximum classification accuracy of the order of 97% resulted case of wastelands. The comparatively poor classification accuracies for wheat and mustard crops could be due to the commissioning of these cropped areas into wastelands and plantations.
It appears that, whenever the crop was poor because of late sowing of wheat, mustard being under unirrigated conditions and also because of adverse effect of salinity on crop growth resulting in low biomass, these areas might have been commissioned into wastelands. The commission errors to tree plantation could have been due to the plantation along the roads or scattered in isolated spots which were not accounted for, while collecting ground truth. The overall classification accuracy of landcover/landuse types were 75.3%.
Since poor mustard and wheat crops seemed to lower the classification accuracy, it was considered essential to make separate classes for early and late sown wheat and irrigated and inirrigated mustard. While collecting ground truth information, although few locations for early and late sown wheat and irrigated and unirrigated mustard were marked, in general all the wheat fields were recorded as one category and all the mustard fields into another category. Therefore, for the preparation of confusion matrix the subclasses for wheat and mustard were combined. The results of crosstabulation are reported in Teabl-2.
By introducing the subclasses, the classification accuracy for mustard improved from 62.7 to 81.2% while for wheat it increased from 74.6 to 77.2%. The omission errors for both the crops were relatively higher than commission errors. The overall classification accuracy increased from 75.3 to 82.7%.
Effect Of Soil And Management Parameters On Normailized Different Vegetation Index
Stepwise regression analysis was conducted t find out the effect of various soil and management parameters on crop growth as expressed by the Normalized vegetation Index (NDVI) and the data are presented in Table 3. The normalized difference vegetation index in case of wheat was mainly affected by soil salinity explaining 42% variation in NDVI, followed by sowing time, contributing another 26%. The other factors which contributing to the variability were silt + clay (6%), number of irrigation (7%) and available soul water storage capacity (1%). Incase of mustard, electrical conductivity (EC) was the most significant variable effecting NDVI with a coefficient of determination of 0.62. Phosphpous was the next important variable having a net contribution of 4%. All the variable put together explained 68% variability in NDVI.
Conclusion
From the results of the present study it can be concluded that, while working wit single date satellite imageries for crop discrimination, weightage should be given to the number of sub-classes where wider growth differences are expected due to management factors like irrigation and doing time et. For single date satellite nyimagery obtained for 1st week of January, the wheat crop growth was significantly affected the sowing date whereas mustard crop was not, owing to its attaining the peak growth by that time. In case of wheat, the crop might not have reached the peak growth stage due to late sowing compared to mustard. Presence of sandy patches within salt affected soils might be a potential source of error in delineation of salt affected soils.
References
Crop discrimination is a basic requirement for acreage estimation and yield prediction by satellite remote sensing. In salt differences in reflectance caused by salt encrustation as well as retarded crop growth due to salinity. Studies were carried out in sultanpur (Gurgaon, Haryana, India) to find our the utility of IRS I LISS II satellite data in delineation of salt affected soils, differentiation of crops grown in these soils and the effect of various soul and management factors on crop growth.
Delineation of the saline and sodic soils could be achieved by Maximum likelihood classification (MXL) of IRS LISS II data obtained for saline souls were differentiated from normal soils are devoid of vegetation. The sodic and saline soils were, differentiated from normal soils with an overall accuracy of 78.2%. Under cropped conditions, during January, the MXL classifier could differentiate wheat, mustard, tree plantation and waste lands with classification accuracies of 74, 68.7, 87.1 and 97.0, respectively. Inclusion of additional classes viz., early and late sown wheat irrigate and unirrigated mustard improved the classification accuracies of wheat and mustard to 77.2 and 81.2%. The attributed to the poor growth of wheat and mustard due to salinity, irrigation and varying dates of sowing. These factors could explain 81% of the variability in Normalized vegetation index values (NDVI) under wheat cropped conditions. With regard to mustard salinity is the major contributor to the differences in NDVI.
Introduction
A major application of satellite remote sensing in agriculture is the identification of crops for acreage estimation and yield prediction. While discrimination and area estimation of crops growing in normal soils have been operationalized (Navalgund 1991), in salt affected souls the differences in reflectance due to salt encrustation as well as the retarded crop growth due o salinity make crop discrimination a difficult task.
The differences in the geometry and growth habits of plant types are manifested in their spectral responses which are used to discriminate various vegetation types. Single date satellite data (Dadhwal and Parihar 1985) as well as spectral temporal vegetation profiles (Badhwar et al. 1982) are used to discriminate various crops. However, the latter method is cost prohibitive and availability of cloud free satellite data on consecutive satellite passes is a limiting factor. Soil background (Major et al. 1990) is one of the most important factor interfering multispectral classification of crops through remote sensing, this is especially important in salt affected soils where crop growth is adversely affected due to salinity.
Landsat data have been used (Singha and Dwivedi 1989 and Saha et al. 1990) for delineation of salt affected soils. Recently, Gore and Bhagat (1991) delineated salt affected soils using IRS data. The present investigations were carried out to study the utility of IRS digital data for delineation of salt affected soils, differentiation of crops grown under salt affected soil conditions and effect of soil and management factors on spectral vegetation index of crops.
Materials and Methods
The study area belong to Sultanpur village of Grugaon District, Haryana State, India for which IRS-IA LISS-II scenes for the months of June 1990 and January 1991 were procured. A base map of 1:7250 scale was prepared from the cadastral map for ground truth data representation. Intensive soil sampling (120m x 125m grid) was done for the characterization of area for salinity/sodicity. By making use of spatial statistics the point data for electrical conductivity and pH were krigged for the preparation of thematic maps to be used in the GIS. Various crops, tree plantation, wastelands and area used for other purposes were carefully recorded in the base map. Information with regard to soil, water and crop management aspects like soil water transmission parameter, a, crop variety, date of sowing kind and time of fertilizer application number of irrigations applied, date of harvesting and yields etc. was also obtained. This information was digitized and converted to IDRISTI is a raster based GIS software with image analysis capability.
The IRS LISS II satellite data were analyzed on IBM PC/AT using IDRSI software. After registering satellite images to the ground truth maps, training sites were selected. These sites were used to generate signatures of various soil types and land use/land cover classes which were used in the supervised maximum likelihood classification algorithm for classifying the study area. For soil type differentiation the June 90 imageries were used, when the vegetation was sparse and for crop differentiation studies, January 91 period images, when the crop was at its peak vegetative growth, were used.
Results and Discussion
Delineation of Salt Affected Soils and Crop Discrimination : In the present study the saline and sodic soils could be classified with a reasonable degree of accuracy (84.5% and 80.4%, respectively). In case of saline soils, the commission errors were from both normal and sodic soils while the omissions were commissioned mainly to the sodic soils category. So, there was more commission errors (83.5%) than omission errors (15.5%) in case of saline soils. In sodic soils commission errors were relatively lower (38.97%), while the omission errors (19.61%) were slightly higher compared to saline soils (Plate 1).
Plate 1 Soil Map of Sultanpur, Gurgaon. (Haryana) Maximumlikelyhood Classification of IRS 1A - LISS II
Plate 2 Land Cover Map of Sultanpur, Gurgaon. (Haryana) Maximumlikelyhood Classification of IRS 1A - LISS II
Table - 1 : Confusion Matrix for Land cover classification
Basic data : all four bands of IRS-IA LISS II for January
Classification method : Maximum likelihood classifier
(One class each for wheat and Mustard crops)
|
| |||||||
| Wheat | Mustard | Tree plantation | Wasteland | Bare | Total | Commission Errors (%) | |
|
| |||||||
| Wheat | 7348 | 1684 | 436 | 19 | 0 | 9087 | 17.67 |
| Mustard | 1151 | 5943 | 20 | 74 | 16 | 7207 | 13.32 |
| Eucalyptus | 243 | 193 | 664 | 59 | 0 | 1159 | 64.96 |
| Wasteland | 1097 | 1638 | 42 | 5161 | 111 | 8049 | 54.26 |
| Bare | 3 | 28 | 0 | 7 | 411 | 449 | 7.06 |
|
| |||||||
| Total | 9842 | 9486 | 762 | 5323 | 538 | 25951 | |
|
| |||||||
| Classification | 74.66 | 62.65 | 87.14 | 96.96 | 76.3 | ||
| Accuracy(%) | 9 | ||||||
| Omission | 25.34 | 37.35 | 12.86 | 3.046 | |||
| Error (%) | 23.6 | ||||||
| Overall | 75.25 | ||||||
| Accuracy (%) | |||||||
|
| |||||||
Table 2: Confusion Matrix for Land cover classification
Basic Data: All four bands of IRS-IA LISS-II for January
Classification Methods : Maximum Likelihood classifier
(Two sub classes each for wheat and Mustard corps)
|
| |||||||
| Wheat | Mustard | Tree plantation | Wasteland | Bare | Total | Commission Errors (%) | |
|
| |||||||
| Wheat | 7601 | 7785 | 24 | 24 | 0 | 8434 | 8.52 |
| Mustard | 1312 | 7704 | 47 | 132 | 23 | 9218 | 15.96 |
| Eucalyptus | 140 | 126 | 661 | 67 | 0 | 994 | 43.70 |
| Wasteland | 794 | 871 | 30 | 5097 | 109 | 6901 | 33.89 |
| Bare | 2 | 1 | 0 | 3 | 406 | 412 | 1.12 |
|
| |||||||
| Total | 9849 | 9847 | 762 | 5323 | 538 | 25959 | |
|
| |||||||
| Classification | 7718 | 81.21 | 86.75 | 95.75 | 75.4 | ||
| Accuracy(%) | 6 | ||||||
| Omission | 22.82 | 18.79 | 13.25 | 4.25 | |||
| Error (%) | 24.5 | ||||||
| Overall | 4 | ||||||
| Accuracy (%) | 82.70 | ||||||
|
| |||||||
Table 3. Stepwise regression analysis of soil and Management Factors with normalized Difference vegetation Index fro Wheat and Mustard.
| Intercept | Regression Coefficients | R3 | ||||||||
|
| ||||||||||
| Nitrogen kg/ha | P2O5 kg/ha | Irrigation | EC ds/m | pH | Sowing | Water Storage | Silt + Clay, % | Alpha | ||
|
| ||||||||||
| Wheat | ||||||||||
| 0.202 | -0.021** | 0.42** | ||||||||
| 1.633 | -0.021** | -0.004** | 0.68** | |||||||
| 1.369 | -0.026** | -0.004** | 0.002** | 0.74** | ||||||
| 1.147 | 0.014** | -0.024** | -0.003** | 0.003** | 0.81** | |||||
| 1.174 | 0.011** | -0.026** | -0.003** | -0.015** | 0.007** | 0.82** | ||||
| 1.159 | 0.0004 | -0.0003 | 0.010** | -0.026** | 0.002 | -0.003** | -0.015** | 0.007** | -0.020 | 0.83** |
| Mustard | ||||||||||
| 0.198 | -0.010** | 0.62** | ||||||||
| 0.211 | -0.0004* | -0.010** | 0.66** | |||||||
| 0.542 | 0.0001 | 0.000002 | 0.016 | -0.009** | -0.015 | -0.001 | -0.001 | -0.0001 | -0.035 | 0.68** |
|
| ||||||||||
| **Significant at p=0.01 | Significant at p=0.05 | |||||||||
With too many spectrally inseparable classes, the classification accuracies may generally be lower. In such cases it becomes necessary to reduce the number of classes. When the number of land cover types were reduced, the classification accuracy was found to increase (Jewell 1989). In the present case, when the saline and sodic soils were clubbed together so as to be differentiated from normal soils, the classification accuracy has gone up to 94.5%.
The signatures for wheat and barley were almost similar and these two crops could not spectrally separated out. Earlier, Dawbin and Evans (1988) has suggested grouping of wheat and barely crop into one category due to overlapping crop calendars and similar agronomic characteristics in NSW, Australia. So, these two crops were clubbed together as wheat, and the class statistics were recalculated. Using these class statistics and maximum likelihood alogorithm, the area was classified into different landuse.land cover types.
The results indicated classification accuracies of the order of 74.7% for wheat and 62.7% for mustard crops. tree plantations gave a classification accuracy of 87.1% while maximum classification accuracy of the order of 97% resulted case of wastelands. The comparatively poor classification accuracies for wheat and mustard crops could be due to the commissioning of these cropped areas into wastelands and plantations.
It appears that, whenever the crop was poor because of late sowing of wheat, mustard being under unirrigated conditions and also because of adverse effect of salinity on crop growth resulting in low biomass, these areas might have been commissioned into wastelands. The commission errors to tree plantation could have been due to the plantation along the roads or scattered in isolated spots which were not accounted for, while collecting ground truth. The overall classification accuracy of landcover/landuse types were 75.3%.
Since poor mustard and wheat crops seemed to lower the classification accuracy, it was considered essential to make separate classes for early and late sown wheat and irrigated and inirrigated mustard. While collecting ground truth information, although few locations for early and late sown wheat and irrigated and unirrigated mustard were marked, in general all the wheat fields were recorded as one category and all the mustard fields into another category. Therefore, for the preparation of confusion matrix the subclasses for wheat and mustard were combined. The results of crosstabulation are reported in Teabl-2.
By introducing the subclasses, the classification accuracy for mustard improved from 62.7 to 81.2% while for wheat it increased from 74.6 to 77.2%. The omission errors for both the crops were relatively higher than commission errors. The overall classification accuracy increased from 75.3 to 82.7%.
Effect Of Soil And Management Parameters On Normailized Different Vegetation Index
Stepwise regression analysis was conducted t find out the effect of various soil and management parameters on crop growth as expressed by the Normalized vegetation Index (NDVI) and the data are presented in Table 3. The normalized difference vegetation index in case of wheat was mainly affected by soil salinity explaining 42% variation in NDVI, followed by sowing time, contributing another 26%. The other factors which contributing to the variability were silt + clay (6%), number of irrigation (7%) and available soul water storage capacity (1%). Incase of mustard, electrical conductivity (EC) was the most significant variable effecting NDVI with a coefficient of determination of 0.62. Phosphpous was the next important variable having a net contribution of 4%. All the variable put together explained 68% variability in NDVI.
Conclusion
From the results of the present study it can be concluded that, while working wit single date satellite imageries for crop discrimination, weightage should be given to the number of sub-classes where wider growth differences are expected due to management factors like irrigation and doing time et. For single date satellite nyimagery obtained for 1st week of January, the wheat crop growth was significantly affected the sowing date whereas mustard crop was not, owing to its attaining the peak growth by that time. In case of wheat, the crop might not have reached the peak growth stage due to late sowing compared to mustard. Presence of sandy patches within salt affected soils might be a potential source of error in delineation of salt affected soils.
References
- Badhwar GD; JS Carnes and WW Austin, 1982. Remote Sensing of Environ. 12: 57-79.
- Dadhwal VK and JS Parihar 1985, Tech Note : IRS-UP/SAC/CPF/ TN/09/85.
- Dawbin KW and JC Evans 1988 Int. J. Remote Sensing 9:295-301
- Gore SR and KA Bhagat 1991, geocarti Int. 6(3) : 5-13
- Jewell N. 19819 Int. J. Remote Sensing 10: 939-951
- Major DJ; F Vater and G Guyot 1990, Int. J. Remote Sensing, 11:727-740.
- Navalgund R R 1991, in 'Space and Agricultural Management, Special Current Event Session, 42, IAF Congress, Montreal, Canad p 31-50.
- Saha SK, M Kudrat and SK Bhan. 1990, Int. J. Remote Sensing 11:485-492.
- Singh A and RS Dwivedi 1989. Int. J. Remote Sensing 10 (1) : 83-92