| GISdevelopment.net ---> AARS ---> ACRS 1994 ---> Agriculture / Soil |
Effect of Time of Data
Acquisition on Crop Identification in North -Eastern India using NOAA
-AVHRR Data
S. Panigarhy S.S. Sharma and J.S. Parihar
Space Applicatiion Centre Ahmedabad 380053
S. Panigarhy S.S. Sharma and J.S. Parihar
Space Applicatiion Centre Ahmedabad 380053
Abstract
Performance of data acquired from morning pass of NOAA 12 and afternoon pass of NOAA 11 for land cover classification was evaluated for north each region of India lying beyond 850E longitude. It was observed that entropy of all the 3 bands viz. Visible NIR and the MIR were higher in NOAA 23 data. The total number of spectral vectors obtained from band 1, 2 and 3 of NOAA 12 was double the number of total vectors from NOAA 11 data. The mean digital number of various known sites showed a reduction of 10 - 35 % in band 1 and 2 from morning to afternoon pass. The computation of percent change in isolation showed that there was significant reduction in morning to afternoon pass time of NOAA in this region, particularly from 86E onwards in the month of October and November. The separability of various land cover classes in general and crop classes in particular were poor in afternoon pass data. The results strongly suggest that morning pass data of NOAA 12 is preferable for such studies particularly in kharif season for this region.
1. Introduction
Among the existing satellite borne earth observations sensors, the Advanced very High Resolution Radiometer (AVHRR) on board the NOAA/TIROS satellite has been found suitable for vegetation monitoring at regional level (Belward 1992). The advantages over the high spatial resolution systems like IRS, LANDSAT are the daily coverage of an area, which largely overcomes of data availability due to cloud cover, a major problem in tropical regions (Currey et al. 1987). This is particularly more useful for studies in Indian subcontinent where number of cloudy days are very high during monsoon season (Rao & Lalitha a1980, Panigrahy et al., 1992). In India AVHRR data has been used to derive useful information on crop area, yield and vegetation condition (Dubey et al. 1991 Panigrahy et al., 1992, Potdar, 1990. However, all these studies in India and elsewhere have used AVHHR data acquired during afternoon pass of NOAA 7, 9 and 11. (Justice 1990, Malingreau et al. 1989, Quaramby et al., 1992). Off numbered satellite are preferred since their overpass are during noon or early noon. The even number satellites 8, 10, 12 are morning polar orbiter with nominal equator crossing time of 7.30 IST, node descending (day time coverage). Over India, the day time passes are around 15.30 hrs. IST for NOAA 11 and 07.30 hrs for NOAA 12.
The present work analyses the comparative performance of morning and afternoon pass data for land cover classification in general and agriculture crop classification particularly in north eastern region of India.
2. Study Area
The study area lies from 820 E to 970 E and 220 N to 280 N comprising states of Assam, West Bengal, Meghalaya and Sikkim. This region harbors a wide range of forests on undulating and hilly terrain's. Rice is the signal most dominant crop which occupies more than 90% of the agricultural area. On the basis of cultural Practices prevailing in this area, there are different rice crops whose growth characteristics differ significantly. The irrigated rice of Burdwan, Hughli are very different rice crops whose growth characteristics differ significantly. The irrigated rice of Burdwan , Hughli are very different from the low land rice of Murshidabad, Noida, the rained rice of cooch Bihar and dryland rice of Purulia in West Bengal. Similarly in Assam there are low land rice to floating bao rice grown in waterlogged areas. The average size of fields in this area is very small (<0.2 ha). However, since rice is grown in large number of contiguous fields, training sites in AVHRR data are available. The crop is grown from July to November month, thus mid October data corresponds to anthesis to grainfilling stage of the crop. The other major land cover found in this area are mangroves (Sunder-bans), tea gardens and water logged areas, besides a range of forest sub classes.
3. Data Based and Analysis Approach
NOAA-AVHRR data of visible (0.55 -0.7m m) NIR (0.71 - 0.98mm) and thermal MIR(3.55 - 3.93mm) were used in the study, as there are the channels extensively used for vegetation studies. The orbital calendar of N?OAA 11 and 12 satellites were the overhead (nadir view) pass of the area was available same day for morning and afternoon passes. Data from two cloud free dates e,g October 6 and October 23 for both the satellites NOAA 11 ad 12 were used in this study. The morning pass was at 0725 hrs IST in descending code and afternoon pass was at 1540 hrs IST in ascending node. The data received at receiving station at the space Applications Centre, Ahmedabad was used. Analysis was done using DIPIX Aries III image processing system.
4. Analysis Approach
The analysis was done in following steps :
The morning pass images were brighter and gave better contrast among different land cover classes as observed in the false colour composite images. Univariate statistics like mean, standard deviation and entropy indicated that there was significant difference between the two images. In morning pass image the data occupied wider range in all the 3 channels compared to afternoon pass. All the channels showed more than 15% reduction in mean digital number in afternoon pass data. Similarly the entropy of each band and different band combinations were higher in the morning pass data. The range of entropy for individual bands of NOAA 11 was only from 2.271 to 2.685, where as it was from 2.958 to 3.036 or NOAA 11 was only 13.110 as compared to 15.534 for NOAA 12 data. This in turn affected the total number of spectral vectors combining channel 1, 2 and 3 for NOAA 12 was 90,000 which was more than 50% of total expected vectors. In comparison to this, in the afternoon pass images, it was only 47745 which is less than 30% of total expected vectors.
Table 3 shows the effect of morning and afternoon data acquisition on spectral signature of different land covers situated at different land covers situated at different locations as shows in Fig.1. This was for the data acquired on October 6, 1993. In channel 1, the reduction of DN value ranged from 2-3% in forest subclass to more than 35% for mangrove, sea water of sunderbans. The agriculture sites of different locations showed 25-30% reduction. Similar order of reduction was observed in channel 2 but the agricultural area showed highest reduction. In channel 3, the reduction ranged from 6-18 %.
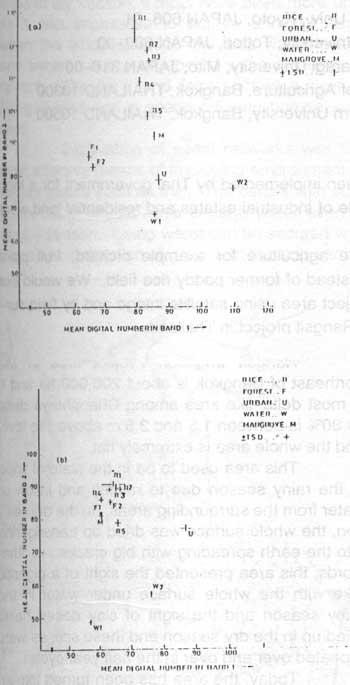
Figure 1 Plots of mean with 1 50 to different land covers and rice-subclasses of West Bengal in band and band 2 of (a) NOAA 12 and (b) NOAA 11
Figure 2 Plots of mean with 1 50 to different land covers and rice-subclasses of West Bengal in band and band 2 of (a) NOAA 11 and (b) NOAA 12
The above observations indicate that there was significant difference in the apparent reflectance of natural surfaces as detected remotely in the morning and afternoon passes. Consequently the separability of various land cover and crop classes were affected. Fig. 1 shows the separability of training class pixel using channel 1 and 2 of NOAA 12 and NOAA 11.
The result showed that except for the urban, water (sea and river) classes, the separability of all other classes were poor in afternoon pass data. The effect was more pronounced for agricultural area. The different rice classes which were distinctly seperable as mentioned earlier were not separable from each other in the afternoon pass data. Also, the mangrove class overlapped with rice subclasses. In morning pass data out of five subclasses for rice, four were separable from each other.
The classification accuracy as observed from the confusion matrix of raining class pixels showed that the overall land cover classification was better than 90% using channel 1, 2 and 3 of morning pass data. The accuracy of rice subclasses varied from 90-95%. Using NOAA 11 data, the accuracy was below 80% for land cover classes.
The vegetation index (NDVI) of different vegetation classes overlapped with each other in NOAA 11 data. The total range was also compressed. It ranged from 0.08 to 0.21 in NOAA 11 and 0.48 to 0.29 in NOAA 12 for the subscene of West Bengal for October 6 data.
The dependence of the total reflectance of natural surfaces upon solar zenith angle is well documented (Rosenberg et al., 1983). In the present study there was change in zenith angel in observation. To asses this change, the zenith angle was calculated for the date and time of pass, as mentioned earlier. Table 4 shows the solar zenith angle of fixed locations for the study area from September 15 to November 15, 1993. It indicates significant difference in zenith angle as one proceeds from 860E onwards further to east.
The total expected insolation over the region will change from morning to evening. The decrease in isolation will be progressively more in November 15 in comparison to September 15. On September 15 it will be from 5% to nearly 50% over the region, whereas on November 15 it will go as high as 26% to close to 80% on the extreme ends of the region. The reduction in insolation over West Bengal from morning to evening passes on October 6 will be 6-28% from 860E to 880E longitude. This will be further more from the areas east of 880E and at 960E longitude it will be more than 60%. The change in isolation is expected to have significantly affected the image quality. Consequently for this region, the morning pass data from NOAA 12 is better suited for monitoring agricultural corps in Kharif and winter season.
6. Conclusion
Variability in channel 1, 2 and 3 of AVHRR data were higher in morning pass images acquired form NOAA 12 than that of afternoon pass of NOAA 1 for the nadir viewing cloud free pass for same day over north eastern Indian Region. Using morning pass data, accuracy of land cover classification was higher. The separability of field crops within agricultural area was also higher. This may be due to significant change in zenith angle which consequently cause change in insolation received by natural surfaces. Thus the morning pass data is more suitable for monitoring kharif crop for the area lying east of 860 E longitude.
References
Performance of data acquired from morning pass of NOAA 12 and afternoon pass of NOAA 11 for land cover classification was evaluated for north each region of India lying beyond 850E longitude. It was observed that entropy of all the 3 bands viz. Visible NIR and the MIR were higher in NOAA 23 data. The total number of spectral vectors obtained from band 1, 2 and 3 of NOAA 12 was double the number of total vectors from NOAA 11 data. The mean digital number of various known sites showed a reduction of 10 - 35 % in band 1 and 2 from morning to afternoon pass. The computation of percent change in isolation showed that there was significant reduction in morning to afternoon pass time of NOAA in this region, particularly from 86E onwards in the month of October and November. The separability of various land cover classes in general and crop classes in particular were poor in afternoon pass data. The results strongly suggest that morning pass data of NOAA 12 is preferable for such studies particularly in kharif season for this region.
1. Introduction
Among the existing satellite borne earth observations sensors, the Advanced very High Resolution Radiometer (AVHRR) on board the NOAA/TIROS satellite has been found suitable for vegetation monitoring at regional level (Belward 1992). The advantages over the high spatial resolution systems like IRS, LANDSAT are the daily coverage of an area, which largely overcomes of data availability due to cloud cover, a major problem in tropical regions (Currey et al. 1987). This is particularly more useful for studies in Indian subcontinent where number of cloudy days are very high during monsoon season (Rao & Lalitha a1980, Panigrahy et al., 1992). In India AVHRR data has been used to derive useful information on crop area, yield and vegetation condition (Dubey et al. 1991 Panigrahy et al., 1992, Potdar, 1990. However, all these studies in India and elsewhere have used AVHHR data acquired during afternoon pass of NOAA 7, 9 and 11. (Justice 1990, Malingreau et al. 1989, Quaramby et al., 1992). Off numbered satellite are preferred since their overpass are during noon or early noon. The even number satellites 8, 10, 12 are morning polar orbiter with nominal equator crossing time of 7.30 IST, node descending (day time coverage). Over India, the day time passes are around 15.30 hrs. IST for NOAA 11 and 07.30 hrs for NOAA 12.
The present work analyses the comparative performance of morning and afternoon pass data for land cover classification in general and agriculture crop classification particularly in north eastern region of India.
2. Study Area
The study area lies from 820 E to 970 E and 220 N to 280 N comprising states of Assam, West Bengal, Meghalaya and Sikkim. This region harbors a wide range of forests on undulating and hilly terrain's. Rice is the signal most dominant crop which occupies more than 90% of the agricultural area. On the basis of cultural Practices prevailing in this area, there are different rice crops whose growth characteristics differ significantly. The irrigated rice of Burdwan, Hughli are very different rice crops whose growth characteristics differ significantly. The irrigated rice of Burdwan , Hughli are very different from the low land rice of Murshidabad, Noida, the rained rice of cooch Bihar and dryland rice of Purulia in West Bengal. Similarly in Assam there are low land rice to floating bao rice grown in waterlogged areas. The average size of fields in this area is very small (<0.2 ha). However, since rice is grown in large number of contiguous fields, training sites in AVHRR data are available. The crop is grown from July to November month, thus mid October data corresponds to anthesis to grainfilling stage of the crop. The other major land cover found in this area are mangroves (Sunder-bans), tea gardens and water logged areas, besides a range of forest sub classes.
3. Data Based and Analysis Approach
NOAA-AVHRR data of visible (0.55 -0.7m m) NIR (0.71 - 0.98mm) and thermal MIR(3.55 - 3.93mm) were used in the study, as there are the channels extensively used for vegetation studies. The orbital calendar of N?OAA 11 and 12 satellites were the overhead (nadir view) pass of the area was available same day for morning and afternoon passes. Data from two cloud free dates e,g October 6 and October 23 for both the satellites NOAA 11 ad 12 were used in this study. The morning pass was at 0725 hrs IST in descending code and afternoon pass was at 1540 hrs IST in ascending node. The data received at receiving station at the space Applications Centre, Ahmedabad was used. Analysis was done using DIPIX Aries III image processing system.
4. Analysis Approach
The analysis was done in following steps :
- Extraction of study area and geometric correction using map-to-image transformation model developed using ground control points and overlaying of state boundaries on the image data.
- Image-to-image registration of morning and afternoon data using a third degree polynomial transformation and cubic convolution resampling.
- Selection of prominent surface features viz. dense forest, mangrove, sea, river, urban (Calcutta) and extraction of windows romcommon location in NOAA 11 and NOAA 12 images.
- Selection of training class sites for various land cover classes and crop sub-classes.
- Generation of training statistics and confusion matrix of training site pixels, classifieds using he maximum likelihood classifier (MLC).
- Generation of normalised difference vegetation inex of vegetation classes.
- Computing solar zenith and azimuth angles as a function of position on the Earth's surface, month, day, year and time of satellite pass.
The morning pass images were brighter and gave better contrast among different land cover classes as observed in the false colour composite images. Univariate statistics like mean, standard deviation and entropy indicated that there was significant difference between the two images. In morning pass image the data occupied wider range in all the 3 channels compared to afternoon pass. All the channels showed more than 15% reduction in mean digital number in afternoon pass data. Similarly the entropy of each band and different band combinations were higher in the morning pass data. The range of entropy for individual bands of NOAA 11 was only from 2.271 to 2.685, where as it was from 2.958 to 3.036 or NOAA 11 was only 13.110 as compared to 15.534 for NOAA 12 data. This in turn affected the total number of spectral vectors combining channel 1, 2 and 3 for NOAA 12 was 90,000 which was more than 50% of total expected vectors. In comparison to this, in the afternoon pass images, it was only 47745 which is less than 30% of total expected vectors.
Table 3 shows the effect of morning and afternoon data acquisition on spectral signature of different land covers situated at different land covers situated at different locations as shows in Fig.1. This was for the data acquired on October 6, 1993. In channel 1, the reduction of DN value ranged from 2-3% in forest subclass to more than 35% for mangrove, sea water of sunderbans. The agriculture sites of different locations showed 25-30% reduction. Similar order of reduction was observed in channel 2 but the agricultural area showed highest reduction. In channel 3, the reduction ranged from 6-18 %.
Figure 1 Plots of mean with 1 50 to different land covers and rice-subclasses of West Bengal in band and band 2 of (a) NOAA 12 and (b) NOAA 11
Figure 2 Plots of mean with 1 50 to different land covers and rice-subclasses of West Bengal in band and band 2 of (a) NOAA 11 and (b) NOAA 12
The above observations indicate that there was significant difference in the apparent reflectance of natural surfaces as detected remotely in the morning and afternoon passes. Consequently the separability of various land cover and crop classes were affected. Fig. 1 shows the separability of training class pixel using channel 1 and 2 of NOAA 12 and NOAA 11.
The result showed that except for the urban, water (sea and river) classes, the separability of all other classes were poor in afternoon pass data. The effect was more pronounced for agricultural area. The different rice classes which were distinctly seperable as mentioned earlier were not separable from each other in the afternoon pass data. Also, the mangrove class overlapped with rice subclasses. In morning pass data out of five subclasses for rice, four were separable from each other.
The classification accuracy as observed from the confusion matrix of raining class pixels showed that the overall land cover classification was better than 90% using channel 1, 2 and 3 of morning pass data. The accuracy of rice subclasses varied from 90-95%. Using NOAA 11 data, the accuracy was below 80% for land cover classes.
The vegetation index (NDVI) of different vegetation classes overlapped with each other in NOAA 11 data. The total range was also compressed. It ranged from 0.08 to 0.21 in NOAA 11 and 0.48 to 0.29 in NOAA 12 for the subscene of West Bengal for October 6 data.
The dependence of the total reflectance of natural surfaces upon solar zenith angle is well documented (Rosenberg et al., 1983). In the present study there was change in zenith angel in observation. To asses this change, the zenith angle was calculated for the date and time of pass, as mentioned earlier. Table 4 shows the solar zenith angle of fixed locations for the study area from September 15 to November 15, 1993. It indicates significant difference in zenith angle as one proceeds from 860E onwards further to east.
The total expected insolation over the region will change from morning to evening. The decrease in isolation will be progressively more in November 15 in comparison to September 15. On September 15 it will be from 5% to nearly 50% over the region, whereas on November 15 it will go as high as 26% to close to 80% on the extreme ends of the region. The reduction in insolation over West Bengal from morning to evening passes on October 6 will be 6-28% from 860E to 880E longitude. This will be further more from the areas east of 880E and at 960E longitude it will be more than 60%. The change in isolation is expected to have significantly affected the image quality. Consequently for this region, the morning pass data from NOAA 12 is better suited for monitoring agricultural corps in Kharif and winter season.
6. Conclusion
Variability in channel 1, 2 and 3 of AVHRR data were higher in morning pass images acquired form NOAA 12 than that of afternoon pass of NOAA 1 for the nadir viewing cloud free pass for same day over north eastern Indian Region. Using morning pass data, accuracy of land cover classification was higher. The separability of field crops within agricultural area was also higher. This may be due to significant change in zenith angle which consequently cause change in insolation received by natural surfaces. Thus the morning pass data is more suitable for monitoring kharif crop for the area lying east of 860 E longitude.
References
- Belward, A.S 1992. Special attributes of AVHRR images for environmental monitoring. Int. our. Of Rem. Sens., 13, 193-208.
- Currey, B., Fraser, A.S and Bardsley, K.L, 1987. How useful is Landsat monitoring Nature, 328, 587-589
- Dubey, R.P., ajwani, N.D and Navalgund R.R, 1991 relation of what yield with parameters derived from a spectral ground profile. J. Ind. Soc of Rem. Sen. 19, 27-44.
- Malingreu, J.P. and Tucker, C.J 1990. Ranching in the Amazon basin. Large scale changes observed by AVHRR. Int. Jou. Of Rem. Sens., 11, 187-189.
- Townshed, J.R.G, and Justice, C.o 1986. Analysis of the cynamics of African vegetation using the normalised difference vegetation index. Int. Jour of Rem Sens. 7, 1435-1445.
- Panigrahy, S.P. Parihar, J.S and Patel N.K 1992, Kharif rice acreage estimation in Orissa unisng NOAA-AVHRR data. Ind. Soc. Of Rem. Sens,. 20, 35-42.
- Pinker, R.T and Stowe, L.L 1990. Modelling planetary bi-directional reflectance over land, Int. Jour. Of Rem Sens, 11, 113-123. Potdar M.B, 1990 Analysis of yiled dependence on crop growth characteristics deduced using NOAA AVHRR data J. Ind. Soc. Of Rem. Sens, 10, 49-56
- Quaramby, n.A, Townshed, J.R.G, Settele, J. White, K.H, Milnes, M. Hindle, T.L and Silleos, N. 1992, Linear mixure modelling applied to AVHRR data for crop area estimation int. Jou. Of Rem. Sens 13,415-425
- Rao, V.R and Lalitha L. 1980. Cloud cover during corpping season in India. A scheme for acreage estimation through remote sensing. ISO Technical report, ISRO-HQ-TN-16-80.
- Reosenbary, N.J, Blad, B.L and Verma, S.B, 1983, Microclimate: the biological environment. John Wiley and sons, New York.