| GISdevelopment.net ---> AARS ---> ACRS 1994 ---> Agriculture / Soil |
Agricultural Applications of
Remote Sensing and Geographic Information System in Land-use and Land
Suitability Mapping
Eng. Hussein
Harahsheh
Royal Jordanian Geographic Centre
Amman-Jordan
1944
1. Introduction Royal Jordanian Geographic Centre
Amman-Jordan
1944
Natural resources in arid and semi-arid area, which is the case of Jordan declining in productivity required special attention, if the determining ecological conditions persist, a further decline in resources may result in desertification which is more permanent. Therefore, we should look for the optimum solution regarding the land-use planning.
The large area perspective of aerial and space-borne remote sending data, their respectively, the ability to reduce field work and decreasing travel cost, and the accurate, timely, complete and cost-effective information, are few of many reasons for the increasing use of remote sensing techniques by resources manager.
Since we need to use different kind of data and information (Soil, Hydrology, geomorphology, topography etc) the geographic information system become a flexible and powerful tool than conventional data processing systems, as it provides a means of taking large volumes of different kinds of data sets and , manipulating and combining the data sets into new data sets as a results can be displayed on maps. In this paper we combines climatic, topographic, soil and land use data sets in order to produce land suitability maps.
2. Study Area
The study area approximately 1200 km2 in extent, lies on the northern plateau of Jordan and situated about 70 km North of Amman. Geological formations occurring with in the area consist of limestone, marls chalky limestone and alluvial of Cretaceous with a small part of Kurnb sand stone. The study area can be divided geomorphologycally into two subareas. The western limestone Ajlun hilly area and the flat alluvial area extending between Irbid and Ramnath. In altitude it range from 600 m to 1000 m. the climat4e is classified as semi-arid Mediterranean climate, which it is recognized by four seasons with warm summer and cold winter, with average annual rainfall caries from 250mm in the east part to mote than 500mm in the west part of the study area.
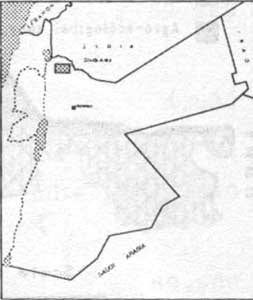
Figure 1: Location of the Study Area
3. Materials and Supporting Data
The most common date for land use analysis are satellite data. They become very popular in recent years because of their better spatial and spectral resolution and their capacity to generate multitemporal products more cheaply than aerial photos. Besides that land suitability analysis needs thematic maps such as soil, slope and rainfall maps. Data on crop rotation \m agricultural statistics and socio-economic conditions are also valuable background information.
The following data were used in this study:
- SPOT XS image of 1989 and SPOT Panchromatic of 1990
- Topographic maps scale 1-100000 and scale 1 - 50000
- Aerial Photos scale 1-30000
- Soil map scale 1-250000
- Rainfal map
- Field informations
4.1 Land use mapping
We after a qualitative analysis using visual interpretation on display image after applying several enhancement and color composition techniques. On a second stage, we utilize the spectral classification techniques, they are based on an automatic analysis and correlations of spectral signature of an object to the object itself. The spectral signature of an object is usually represented by characteristics reflectance curves in the part of the solar spectrum, covered by satellite sensor (e.g. Landsat, SPOT). Soil and vegetation spectral signatures like those of other objects, vary according to parameters such as moisture and state of vegetation etc.
Thus for vegetation, absorption in the red band is related to the reasons of chlorophyll. While reflectance in the NUR and depends on the leaf structure. Wet soils have a lower response in all bands than dry soils.
Figure 2. Simplified spectral reflecance curves for five surface in the visible and near infrared parts of the electromagnetic spectrum. Example channels of SPOT, Landsat and Noaa sateilite sensors are shown
Spectral classification techniques can be grouped into supervised and unsupervised classification. In out case of study we utilize the maximum likelihood supervised classification which is consist of two steps.
- The user defines training areas of each these or class to be classified
- The system then computer the values of all pixels of the image and allocate according to the maximum likelihood rule each pixels of the image to one of thematic classes defined by the values of the corresponding training areas.
Land suitability evaluation is the process of assessing the suitability of land for specific use. These may be major kinds of land use such as rainfed agriculture, livestock production and aforestations. The topographic characteristics, the climatic conditions and the soil quality of an area are the most important determinant parameters of the land suitability evaluations. In our study case we applied the rules used by the food and agriculture organization FAO published on the frame work of land evaluation.
Geographic information system methodology was used to evaluate the land suitability. It can be defined as a digital processing system of georeferenced data it's main functions concerning; an automatic editing of existing maps, provides the possibility, after digitizing of boundaries and themes on existing maps to produce derived maps by digital updating of boundaries, extracting selected themes or by superimposing different maps together in a desired projection and scale, and the possibility of combining different levels of geographical data using logic and arithmetic operators. These capabilities allow the construction of models from which a new thematic maps (e.g. land suitability map) can be produced from a set of thematic maps (e.g climate, soil topography and land cover).
Three land suitability maps were produced using GIS methodology:
- Land Suitability for annual crops.
- Land suitability for annual crops.
- Land suitability for agriculture use (synthetic result)
5.1 Land use
The digital image processing used for land - use mapping are as follows:
- Geometric correction of the SPOT XS image using a top[ographic map scale 1/50000.
- Digitizing and registration of the aerial photographic to SPOT image
- Integration SPOT panchromatic image with the SPOT XS to produce a natural color image (XS + P).
- Producing the following indexes:
- Vegetation index (VI) = XS3 = XS2/XS3+XS2
- BRINGTHNESS INDEX (SI)2 = XS3)2 + (XS2)2
- COLOR INDEX (CI) = XS2 - XS1/XS2+XSI
- Enhancement of images :
- Stretching
- Filtering
- Ratio
- Principal component analysis
- Supervised classification using the maximum likelihood rule Our
methodology of supervised classification consisted of the following
steps:-
- Introducing the "Training Samples" and using the 3 band of spot images to generate the signature file for each class.
- Masking the vegetation cover using the vegetation index on one theme mask.
- Applied the maximum likelihood classification in the previous
masking area at this stage we distinguished the following
classes:-
1 - Forest 2 - Orchards 3 - Vegetables 4 - Rangeland - Masking the urban area of manual classification on the masked urban area, this allowed us to distinguish three classes.
- Applied the maximum likelihood classification on the masked urban
area, this allowed us to distinguish three classes :-
1 - High dense urban Area 2 - Low dense urban area 3 - No urban area - Extracting specifics urban area by manual interpretation :
1 - Industrial area 2 - Educational Area 3 - Transportation area 4 - Roads network - Applied the maximum likelihood classification to the unclassified area (not masked) to find out the other classes
- Grouping all of classes in one file.
- Generalizing the classification to remove out the uncorrected classified pixels.
5.2 Land Suitability
The production of land suitability maps was required the following digital images processing :
- Digitizing the soil, rainfall and slope maps.
- Georeferencing database soil, rainfall, slope, spot image etc.
- Updating and superimposing soil, rainfall and slope maps using logic
and arithmetic operators according to the FAO land evaluation framework.
Two land suitability maps were produced.- land suitability map for annual corps
- land suitability map for orchards crops.
- Depending on the previous results, the land use map and the regional priority a general land suitability map was produced.
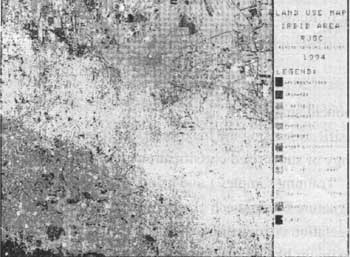
Figure 3
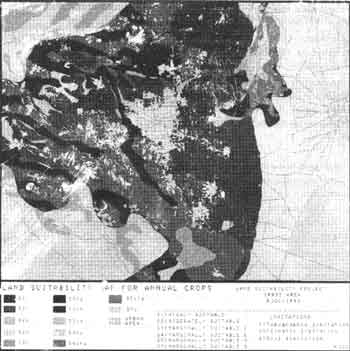
Figure 4
6 Results and Conclusions
One of the important advantages of the digital classification is to produce automatically the exact acreage classes in a particular zone. From the statistic results in this study we can note the following remarks:
- The surface of annual corps and rangeland is about 520 km2 973% of the study area) which indicate that planners of land use can change on their panes 73% of the study area.
- We can consider that 63% of the study area is highly suitable for tree crops and without limitations, 31% of the study area has a good suitability with one limitation (soil, topography or climate)
- For the annual crops, about 20% of the study area us highly suitable without any limitation and 32% has a good suitability with one limitation at least.
- The general land suitability map show that 50% of the study area should be oriented to the annual crops cultivation. Which is a predominant needs. Also 32% should be used for orchards crops and afforestations.
- For range land needs we may use the moderately land suitability and less suitable.
- We note that the expansion of urban area practice generally on the highly suitable land for annual corps. Which is considered very dangerous and we have to put end of these practices.
- We recommended to generalize this model for the all of country.
- David A. Davidson "Soil survey and lad evaluation", 1980
- Donald A. Davidson "Soil and land use planning" 1980.
- FAO, "Frame work of land evaluation", Rom 1976.
- Hussein H "Application of R.S techniques in the natural resources management". International symposium "Operationalization of remote sensing", 1993 ITC, The Netherlands.