| GISdevelopment.net ---> AARS ---> ACRS 1994 ---> Agriculture / Soil |
Rice Crop Monitoring Using
RADARSAT - simulated SAR Imagery
Gordon C.
Staples1, Stephane Rossignol1, Dennis
Nazarenko1, Greg Elms1, Chao Wang2,
Huadong Guo2, Ron Brown3, Brian
Brisco4
1 RADARSAT International, Richmond, British Columbia, Canada
2 Institute of Remote Sensing Applications, Beijing, China
3Canada Centre for Remote Sensing, Ottawa, Ontario, Canada
4Intera Technologies, Ottawa, Ontario, Canada
Abstract
1 RADARSAT International, Richmond, British Columbia, Canada
2 Institute of Remote Sensing Applications, Beijing, China
3Canada Centre for Remote Sensing, Ottawa, Ontario, Canada
4Intera Technologies, Ottawa, Ontario, Canada
Airborne SAR imagery, acquired of Sihui, Zhao Qing, China in November 1993, was modified to produce a RADARSAT simulated Standard Mode (25 m resolution) image, Ground truth information was used to identify mature rice crops, rice stubble, banana crops, and aquaculture ponds. Land use class distributions from the RADARSAT simulated image were analyzed. Comparison of the mean DB and histograms of each land use class indicated significant differences, but with out a priori knowledge of land use, unsupervised classification was not possible. Orbati planning software predicting RADARSAT standard mode coverage indicated an adequate number of viewing opportunities were available to support operational multitemporal observations during the rice-crop life cycle.
1. Introduction
China, India and Indonesia are the leading rice producing countries with China and India accounting for 50% of the world's supply of rice (1). The socioeconomic importance of rice combined with urban growth and the requirement for cost effective monitoring of the rice crop have lead these countries to investigate methods to augment traditional land based monitoring with space borne sensors. Effective rice monitoring programs should provide information on the growth stage of the rice, the planted and fallow acreage, and the crop yield. Previous studies using space borne optical sensors (Landsat and SPOT) provided high resolution multi spectral imagery for crop discrimination and rice crop growth stage identification. Multi spectral Advanced Very High Resolution Radiometer (AVHRR) imagery can provide extended spatial coverage at the expense of reduced resolution. Optical sensors, however, are limited to reasonably could-free viewing conditions which poses a significant constraint for operational rice crop monitoring.
The cultivation cycle as defined by identifies five stages for wetland rice growth: fallow, flooded, growing crop, ripening crop, and stubble investigations using ERS-1, SAR and airborne X-band SAR data have identified the rice growth stages based on the backscatter variability. Using VV polarised ERS-1 SAR, studies showed that low backscatter from specular reflection in the flooded stage increased dramatically due to corner like reflections and volume scattering during the growing through ripening rice crop stages, combined with constraints requiring observations at appropriate time intervals, makes rice monitoring a viable activity following the launch of the RADARSAT satellite.
With the opening launch of RADARSAT in early 1995, we identified two major objectives for the rice crop study. The first objective focused on technical capability issues - understanding the utility of RADARSAT data to monitoring rice crops and to delineate and differentiate rice fields from the crops and land use classes. This objective was investigated using a RADARSAT simulated image of th Sihui Country, Zhao Qing, China. The second objective dealt with ligistical capability issues - developing an operational scenario for rice crop monitoring using a orbital planning software routine which predicts RADARSAT coverage as a function of user - selected incidence angles, resolution and coverage frequency.
The outline of this paper is as follows. Section II summarizes the geography of Sihui Country, followed by descriptions of the data sources and data analysis techniques in Section III. In addition, the Intera SARPAC RADARSAT simulation process is briefly discussed. Section IV presents image analysis and processing results and observations. Sections V develops the operational coverage of RADARSAT over the study region as a function of incidence angle and beam modes. The final section offers concluding comments.
2. The Study Area
Sihui Country, located in the southeast corner of china, is in the Southern Uplands geographic region, this region is fairly mountainous with the only level terrain located in the delta of the River Xijiang. Nutrient-rich soils and a tropical climate support active agriculture along the delta, but in the mountainous regions, little land can cultivated, even by terracing. Rainfall in the southeast corner is the heaviest in China and averages 100 to 200 cm per year. Rice is a dominant crop in this region , and the precise dates for planting and harvesting vary depending on the weather and cultivation practices. The season begins typically in May or June and concides with the onset of the main monsoon showers. Traditional varieties of rice require four to five months to reach the harvest stage, while modern varieties require about three months to reach harvest. Typically, two rice crops are grown during the summer months while a third crop is usually planted in driest months just prior to the monsoon season. The availability of water for irrigation, however is the limiting constraints on the number of crops planted per year.
Fig1. Teh Zhao Qing study area. The town of Gangli is indicated by the letter G
A. Airborne SAR Data
As part of the Globe SAR program, airborne SAR imagery was acquired along the Rive Xijiang on November 20, 1993 from the CV-580 aircraft operated by the Canada Centre for Remote Sensing (CCRS). The CCRS CV-580 aircraft acquired Nadir Mode C-band HH polarized imagery with a 6m nominal resolution (range and azimuth) and 4 m nominal pixel characterized by nadir viewing in the near range with approximately 760 incidence angel in the far range, and a swath width of roughly 22 km. Post processing of the airborne SAR image included modification to create a simulated RADARSAT standard mode image. The airborne data are initially converted from slant to ground range and corrected for antenna pattern effect. The SARPAC routine takes the airborne C-band HH polarized image as input, and using a bilinear interpolation procedure, outputs a RADARSAT - simulated standard Mode image (25 m resolution and 12.5 m pixel spacing). The SARPAC routine also applies a "speckle ball" to the image to simulate radiometric characteristics of RADARSAT.
Once launched the RADARSAT standard mode data (100 km x 100m scene size) will consist of seven distinct beam positions, with stepped incidence angles that vary from 200 in the near range to 490 in the far range, encompassing a total swath width of 500 km. Although the airborne data are acquired in incidence angles from nadir to approximately 760 in the far range, the RADARSAT simulated image is readiometrically balanced to represent incident angle variations through the larger incident angle range of the RADARSAT standard mode (approximately 400 to 490)
B. Image Analysis
The RADARSAT simulated image was filtered using a 7 x 7 lee adaptive filter. The effect of this filter was to substantially reduce the speckle while preserving the high frequency spatial detail. The institute of Remote Sensing Applications of the Chinese Academy of Sciences provided ground truth information via interpretation of the RADARSAT simulated image. Refering to mature wetland rice, in the ripening growth stage and ready for harvest, was identified in (RN) and (RF) and stubble (harvested rice) was evident in (SM). A banana crop (BF) that had started to bear fruit was noted. Aquactulture ponds, where fish and ducks are raised are evident in(AN)and (AF). In addition, the gorgon euryale plant used for medical purposes is also grown in ponds. Other feature in the RADARSAT simulated image include the town of Gangli, the Lankeshan Uplands in the lower left hand corner, and the Riber Xijianf which is the dark strip traversing the central portion of the image.
Land use statistics were based on training areas selected from the interpretation map of the RADARSAT simulated image. Training areas representing rice, stubble, bana, urban and acquaculture ponds were analysed to produce the mean and standard deviation grey-level digital number (DN) and class histograms. Sample sizes were selected to assure an error of less than 1.1 % on the mean DN at a 90% confidence interval. Bot the histograms and the simulated RADARSAT standard mode image were visually evaluated to determine land use class seperability.
4. Results and Observations
The RADARSAT Standard Mode Simulation image was analysed to determine if selected land use classes were sufficiently different to be identified accurately. Five classification sites (as defined previously) were selected based on ground truth information and knowledge of the area. DN distributions for each sample class were plotted and mean and standard qualitative assessment found positive separability results four out the five classes selected had a distinct mean and histograms showed significant differences.
The pond class was characterized with a very low mean DN and relatively low standard deviation. This class was seperable from all other classes.
Mature rice had a mean of approximately 119 DN and a standard deviation ranging from 14 to 18.3 and was clearly separable from the urban class (mean of 181.8 standard deviation of 26.45). The mature rice class was also significantly different from the harvested rice stubble and banana classes but showed some confusion in the higher range mature rice DN and lower range banana and rice stubble DN.
Banana and harvested rice stubble had slightly different means but high standard deviations. These two classes could not be clearly separated on the basis of their distributions but showed texture differences that visually increased their separability between crops is being investigated with other GlobeSAR sites and will be reported on in future publications.
Whenever possible, the class samples were selected in separate locations on the image which allowed for the comparison of two similar classes to validate the selection of the training areas. The two acquaculture-pond class characteristics were found to vary quire significantly. The varications observed, however, are believed to have been caused by floating aquatic vegetation (gorgon euryale) in the ponds in one of the locations which contributed increased backscatter.
In the case of the mature rice class, it was observed that the mean, standard deviation and distribution for the two test sites did not vary significantly.
In the present study, incidence angle backscatter dependence for the various classes was not investigated. A previous on theoretical modeling of backscatter from rice crops found that X-band HH polarized SAR backscatter decreased by upto 5 dB for mature rice and 2 dB for early season rice within the incidence angle range of 20 to 500 (15): the incidence angle range of the seven RADARSAT standard mode positions. These results would tend to indicate that high frequency HH polarized SAR backscatter of rice crops decreases with incidence angle. However, the incidence angle / rice crops backscatter relationship is a linear one and will be easily accounted for when monitoring sites using RADARSAT data from various beam positions (varying incidence angle ranges)
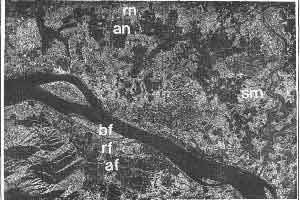
Fig.2 Simulated RADARSAT Standard Mode image of Zhao Qing China (25 m resolution, 12.5 m poxel spacing). The imagecovers approximately 16 km x 22.5km with the near range at the top of the image
5. Rice Crop Monitoring with Radarsat
Techniques employed for rice cultivation and the resulting variations in field conditions produce changes in the SAR baclkscatter signal which are readily monitored during the growing season. Based on the work of (2), (8) and (15), backscatter during the follow stage depends on the surface roughness and soil moisture. During the flooding stage, specular reflection from the water decrease the backscatter. As the plants grow, expanding vertically and horizontally, corner-like reflections and volume scattering increase the backscatter which peaks during the ripening stage. After tillering, prior to rice harvest, backscatter decreases due to a decrease in water content in the rice plant. Following harvest, the backscatter during the stubble stage may increase or decrease sharply depending on harvesting techniques and water management practices.
The backscatter dependence on rice growth stage using Simulated RADARSAT data is being investigated as part of the Thailand GlobeSAR project. Rice at different growth stage has been identified in data collected in Thailand and will help to validate the techniques proposed in the following paragraphs.
Based on results of earlier studies and observations from the present study, a theoretical operations scenario for rice crop monitoring using RADARSAT was investigated.
Using RADARSAT, data, a first acquisition in the early seasons would identify the flooded fields which resemble acquaculture ponds as noted in the present study. Delineation of the newly-planted rice crop would be enhanced by RADARSAT's HH polarization which is less sensitive to wind induced surface roughness effects, and RADARSAT's variable incidence angles which shows increased specular reflection at larger incidence angles. Field boundaries would be distinguished during the flooring stage because of the high contrast with flooded fields.
A second acquisition in mid-season would allow for the differentiation of rice from ponds and other land use classes given the characteristic backscatter increase as the rice plant matures. The mid-season image would also permit the calculation of crop acreage as well as an early assessment of crop health based on knowledge of the local historical crop cycle.
A third acquisition in the late season combined with information on the relationship between backscatter and crop-yields per selected area would produce an estimate of the total rice-crop yield. The combination of these acquisitions would validate rice field classification and provide good discrimination with urban classes and orchard corps (such as banana and mango) which maintain a relatively constant backscatter during the rice crop growing cycle.
Orbital planning software was used to predict RADARSAT coverage as a function of beam mode and incidence angel for the defined operational scenario. A 100 x 100 km region (roughly one RADARSAT standard mode scene) centered on the current sudy area was selected to investigated RADARSAT standard mode coverage (seven beam modes with incidence angels between 200 to 490) for the 24 - day orbit-repeat frequency. The bar chart shows nine viewing opportunities using all seven modes covering atleast 75% of the region are available during the 24-day period. In a worse case scenario, at least one acquisition during a 24 day period could be acquired with any of the seven standard beam positions.
It should ebb noted that the 100 x 100 km region tested was selected arbitrarily and vertically followed meridian lines. The inconsistency in coverage efficiency (percentage of area covering) between beam positions is due to the fact that the RADARSAT orbit has an inclination of 98.60 from the equator, and this does not follow median lines. The selection of a smaller area for RADARSAT coverage prediction would yield results of higher efficiency.
| Land Use Classes | Location Indicated on Fig.2 | Mean (DN) | Standard Deviation (DN) | Sample Size (Pixels) | Number of Training Areas |
| Mature Rice | RN | 119.40 | 18.33 | 8586 | 2 |
| RF | 119.30 | 14.02 | 3298 | 2 | |
| Harvested Rice Stubble | SM | 140.99 | 21.12 | 3312 | 6 |
| Banana | BF | 135.46 | 18.88 | 5312 | 2 |
| Urban | not shown | 181.87 | 26.45 | 1248 | 6 |
| Aquaculture Ponds | AN | 9.97 | 10.45 | 3588 | 6 |
| AF | 20.23 | 5.33 | 1892 | 12 |
 |
 |
Fig.3 Normalized DN distribution for mature rice (RN in Fig.2) and aquaculture ponds (AN in Fig. 2)
6. Conclution
A single RADARSAT simulated Standard Mode image a Zhao Qing, China when merged with ground truth information identified rice crops, aquaculture ponds, banana crops, and urban areas. Simple statistical analysis indicated that land use classification based on the mean DN was possible, but without a priori knowledge of land use, high standard deviation of the distribution of the classes precluded the use of unsupervised classification. Multi temporal analysis such as proposed in the previous section should yield better class separability results. Relative SAR calibration, to remove system effect, will be required for multitemporal monitoring. The planned RADARSAT calibration will allow for the required corrections and permit multitemporal analysis. With RADARSAT data, it is expected that delineation of the rice-crop flooded stage will enhanced by increased specular reflection at large incidence angles and the decreased sensitivity to wind-included surface roughens effects by RADARSAT's HH polarization.
Orbital planning software predicting RADARSAT standard mode coverage indicated that an adequate number of viewing opportunities were availabel to provided multitemporal coverage during the rice-crop life cycle. A multitemporal analysis scenario using RADARSAT data was proposed. Given the expected capabilities of the satellite, RADARSAT should provide adequate operational rice crop monitoring.
| Ricec Crop Stage / Acquisition time | RADARSAT Response | Information Provided | |
| Acquisition 1 | Early season flooded paddies and fallow fields | Low response from flooded fields | 1)Field boundaries 2) Separability of flooded rice paddies with other crops |
| Acquisition 2 | Mid season growing crop | Increase in backscatter of rice paddies relative to acquisition 1 and other land use classes | 1)Early crop health and growth
assessment 2) Crop acreage calculation 3) Separation of ponds and rice paddies |
| Acquisition 3 | Late Season mature rice | Levelling of backscatter | 1) Validation of rice crop
classification 2) Final crop yield assessment |
Fig.4 RADARSAT image acquisiton opportunities for area coverage of least 75% during a 24-day RADARSAT orbit-repeat cycle
| Coverage during the 24 day repeat Fequency | Standard Beam Mode Positions |
| Day 2 | S 1 |
| Day 3 | S 3 |
| Day 8 | S 7 |
| Day 9 | S 7 |
| Day 12 | S 3 |
| Day 13 | S 1 |
| Day 16 | S 6 |
| Day 19 | S 2 |
| Day 20 | S 2 |
Acknowledgement
The airborne SAR image was provided by the Canada Centre for Remote Sensing and the Institute of Remote Sensing applications (China). Airborne SAR data collected as part of GlobeSAR, sponsored by Natural Resources Canada, the Canadian Space Agency, and the International Development Research Centre.
References
- United Nations, food and Agriculture Branch, New York, 1988.
- Achbacher, Josef, D. Paudyal, "Studies of rice in Thailand using ERS-1 data", Proceedings National Conference on ERS-1/Landsat/SPOT Applications : A complimentary Approach 23-25 November 1993, Jakarta, Indonesia.
- Barrs, H.D,S.A Prathapar, "Remote Monitoring of Rice Areas" Proceedings Seventh Australian Remote Sensing Conference. 1-4 March 1994 Melbourne, Australia.
- Brown, R.J, B. Brisco, F.J Ahern, C. Bjerkelund, M. Manore T.J. Pultz, V. Singhroy, "SAR application Calibration Requirements" Canadian Journal of Remote Sensing, Vol 19, No. 3 August 1993.
- Malingreu, Jean-Paul, "Monitoring tropical wetland rice production systems: A test fo orbital remote sending", in : Remote sensing and tropical land management. Edited by M.J Eden, J.T Parry, John Wiley and Sons, New York 1986.
- Dirgahayu, Dede, "the use of NOAA AVHRR data for determining the growing period of rice in Subang, West Java, Asia Pacific Remote Sensing Journal, Vol 4 No 2 P. 65-68, 1983.
- Hogg, R.V, J Ledolter, Applied Statistics for Engineers and Physical Scientist, Maswell Macmillan Publishers, New York 1992.
- Kurosu, Takashi, T. Suitz, M. Fujita, K. Chiba and T. Moriya, "Rice crop monitoring with ESR-1 SAR: A first year result" proceedings Second ERS -1 SAR: A first year result. Proceedings second ERS-1 symposium-space at the service of our environment, 11-14 October 1993, Hamburg, Germany.
- Lapp, David J, Fred Campbell, William Bayer, and Michael Kirby, "Canada Prepares for RADARSAT with Airborne SAR Data, Earth Observations Magazine, Vol 3, No. 1 Janaury 1994.
- Barker, Randolph, Robert W. Herdit and Beth Rose, The Rice Economy of Asia, McGraw Hill, New York, 325 pp. 1985.
- Parashar, S., G.J Wessles, "Synthetics Aperture radar data simulation software package at CCRS". IGARRS '89 - the 12 Canadian Symposium on Remote Sensing, 10-14 July, Vancouver B.C, Vol 3, pp 1729-1732, 1989.
- Raney, T. Keith, A Lucscombe, E. Langham and S. Ahmed "RADARSAT" Proceedings of the IEEE Trans. Vol 79, No 6 June 1991.
- Raney, R.K G.J Wessels, "Special Considerations in SAR Speckle Simulation", Special IEEE Trans Geoscience and Remote Sensing Vol 26 No 5 Sept 1988.
- Srivastava, S.K, N.W Sheppard, R.K Hawkins, T.I Lukowski, "Calibration of RADARSAT Proceedings of IGARSS. Aug 1994 Pasadena, California pp 1099-1101.
- Toan, T. Le, H. Laur E. Mougin and A Lopes, Multitemporal and Dual Polarization observations of Agricultural Vegetation covers by X-band SAR images, IEEE Trans Geosci and Remote Sens Vol 27, No 6 pp 709-718 1993.