| GISdevelopment.net ---> AARS ---> ACRS 1992 ---> Poster Session P |
The study of relationship
between the ground targets spectral data and ATH data
Zhang Z. G.
Centre Fore Remote Sensing in Geology, 29 College Road, Beijing 100083, P.R.C.
Centre Fore Remote Sensing in Geology, 29 College Road, Beijing 100083, P.R.C.
Abstract :
In this paper, based on analyzing action between magneto electric wave through the atmosphere and the ground targets each other, mathematical model of the relationship between the ground targets spectral data and ATM data is derived from theory, and the physical significance or correlation parameters are given. According to ATM data (DS-1208 Scanner) and the spectral data of the field synchronization measurements (IRIS Spectroradiometer) at three test fields (Goldsea lake, Gaoyang and Anxin county), by using the analysis method of the statistical regression, the linear regression equations between the DN of each band of ATM (total twelve bands) and the reflectance brightness of the ground correspondence wavelength the are obtained under all kinds of conditions, (such as different test fields, periods, flight heights and detection angles etc.). Taking advantage of this quantitative relationship equation, the original images of ATM are directly transformed into the ground efficient reflectance brightness images. In the transformation procedure, the atmospheric transmittance and path’s radiance don’t need to know. The efficient reflectance brightness images is able to reflect the ground targets spectral properties. Therefore, the effects of the atmosphere between the ground and the DS-1268 sensor are eliminated, and the image order is apparently improved. Moreover, the relationships between the atmospheric transmissivity and flight heights detection angles and the atmospheric transmissivity are discussed.
Introduction
We know, the multispectral data of the space and aeronautics Remote Sensing are the reflective and radiant results of the earth objects. Aeronautic Remote Sensing data has not only to do with reflective properties of the earth objects, but also with the sun luminance, atmospheric transmittance properties and sensitive properties of sensor. This paper tries to quantitatively study the relationship between the ATM data and spectral data of the earth objects. Although this is a very important work, it is doubtless on the deeping Remote Sensing technique and data quantitative application of Remote Sensing, the research is vary difficult and complex.
Theoretical Model
The electromagnetic wave reflected and radiated by earth objects is measured, it is foundation of Remote Sensing technique. So as to quantitative approach relationship between airborn multispectral data and reflective properties of earth objects, it is very necessary that relation model of sensor response and reflective property of earth objects is created, this model is named for Remote Sensing equation in the paper[4]. Regardless space or aeronautic Remote Sensing technique, when their sensors measure earth objects, the electromagnetic waves all go through the atmosphere. Generally, the atmospheric effects are considered in the Remote Sensing equation, it is expressed as:
- Because of the atmospheric absorption and diffusion, the sun radiation from atmospheric outer does not all reach the ground; there is a part of radiation from earth objects reflecting can enter the sensor.
- Because of the atmospheric diffusion, radiation without reaching the earth has small part radiation entering the sensor.
- The reflective radiance of around the object because of the atmospheric diffusion, a part of that enters the sensor.
Now, the other conditions are considered:
- Wavelength ranges is from l1 to l2 .
- The solar zenith is q .
- The surface of earth objects is approximation to Lambertian surface.
- The sun’s irradiance distribution in the outer atmosphere is Eo(l).

Where b (l) is the atmospheric efficient brightness. It depends/ on the atmospheric properties.
Fig. 1 The relation of incident radiance atmosphere, background, target, reflective radiance and sensor. The radiant brightness of background reflection (Bb) is expressed as:
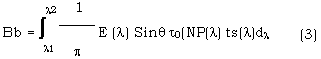
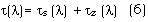
Where r` (l) is the average reflectance of background. tq (l) is atmospheric transmittance (direction of incident). It depends on the atmospheric diffusion properties. ts (l) is the atmospheric transmittance of reflective direction.
The radiant brightness (Bt) is from the reflection of the target cross atmosphere it has not only t do with the target reflectance, but also with atmospheric absorption, diffusion properties and transmission path. It is expressed as:
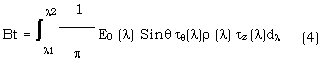
Where r (l) is the reflectance of target, tz (l) is direct transmittance. It’s only depended on atmospheric absorption and diffusion in the reflective direction.
If the S (l) is the spectral response function of the sensor, then the total response (D) of the sensor is expressed as:

When earth objects are very even within large area, t` (l) of the background is about r(l) of targets. One let:
When earth objects are very even within large area, t (l) is the total transmittance of the atmosphere in direction of incident and reflective radiance. Thus the equation (5) is changed into the equation:

As to the Remote Sensing system of airborn multispectral scanner, let i indicate band, j indicate earth objects. Then equation (7) is rewritten as:

Because Daedalus enterprise incorporation. That Supplied us with relative response functions Sni(l). Make

Where Spi (l) is the peak of response functions Si (l) .

Where Ee (l) is a irradiance distribution of the sun on the earth.
Considering designed band in the window of the atmosphere, the band is comparative narrow, in this case, t (l) is taken the place with ti, then.

that is

In this equation.
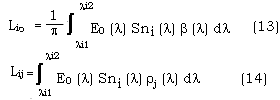
where Lio is the efficient reflective brightness of atmospheric diffusion associated the band and sensor response. It isn’t associated with the earth objects, Lij is the efficient reflective brightness of targets associated with the band response of the senor.
If even considering DS-1268 with different gain channels of selection, so as to acquire reasonable read number the different irradiance condition, without radiant energy entering the sensor, there is still read number output. It is called as zero input response (Loig). Thus equation (12) is supposed to

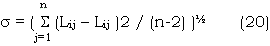
equation (15) is reversed into the efficient reflective brightness of the earth objects. That is
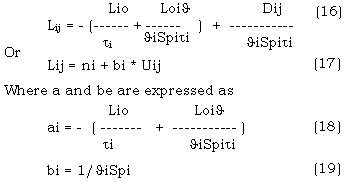
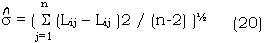
Where a is efficient radiance brightness of atmospheric diffusion and response of the sensor, b is the efficient reflective brightness variation of the earth objects. As above the equation (17) shows that relationship between the efficient reflective brightness of the earth objects (Lij) and total response (D) with sensor each band is linear relation. This is the theory model of the paper.
Test Arrangement and Data Acquisition
1. Be Ready Before Test
- The reflectances of selected the earth objects are steady in the short time (e.n., highway, water, soil, living vegetation, and the man-made cloth targets etc.).
- There is some number about the type of earth objects. So as to make the regression equation be reliable, one considers the requirement of each band and the practical situation, selects seven to …… types of earth objects, also selects the different color cloth targets (size is 6 x 6 m2), they are …… while, yellow while, light grey, dark grey and black color clothes targets. Being ready cloth targets is for winter, in which there are only a few natural earth objects.
- The reflectance values of selected earth objects have such a extent that it includes all kinds of possible selective properties with each band. The reflectance from 0 to 100 percent is distributed to the full extent equablely in all kinds of types earth objects.
- The sizes of the earth objects are enough large for the pixel area, and the reflective properties are steady. If pixel’s area is 2.5 M2, in order to acquire a pure pixel (no mixture-pixel), the size of cloth targets is 5 x 5 m2 at least.
- Select earth objects which have fairly good Lambert property. To avoid the influence of incident and view angle, one measure the Lambert property of cloth target before test. In addition, avoid taking place the primary and recall reflection being measured the water.
- Select the level earth objects for convenience.
The calibration of IRIS Spectroadiometer. In order to obtain the correction reflectance data, IRIS Spectrometer must be calibrated again, and the gain/dark current file, detector function file, wavelength file are recreated, the radiance calibration was done, the new radiance file was created. Thus, the sun spectral irradiance is measured with IRIS Spectrometer (Fig. 2).
Fig. 2 The sun spectral irradiance measured at the goldsea lake field of 24th September 1989.
DS-1260 was improved into DS-1268 BY Daedalus Corp. in 1989. This instrument has fairly good response properties. For requirement of calculation, the relative response function Sni (l) of DS-1268 is normalized to make the response function v. the same wavelength file (0.4 – 2.5 mm), in Fig.3.
Fig. 3 The response function curves of DS=1268 sensor
Fig.3 The response function curves of DS-1268 sensor.
3 The Synchronization Measurement Technique
The so-called synchronization measurement means the ground measurement and flight scanning are ………. At the same time. In the field, it isn’t only very difficult that the reflectance is measured full …. Chronization with the flight scanning, but also impossible. On the basis of theoretical analysis, it is known that the reflective properties have no ….. in short time, it isn’t necessary to measure reflectance of earth objects at the synchronization. …. The airplane is overhead in flight scanning, the spectral measurement of the ground only measures the sun radiant energy at this time, then the sun reflectance brightness Ee (l)/p on the Lambert surface ( r =1 ) … obtained. therefore, make the synchronization measurement be feasible. The cloth targets are placed the nadir of flight line. The same color cloth targets is placed in the scanning line (in Fig. 4) with the equality interval.
- Snow white cloth target
- grey target
- dark grey target
- black target
Fig. 4 The location of cloth targets placed in anxin field in Hebei province.
Acquisition Data
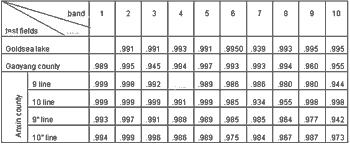
The measurement of the ground spectral and airborn multispectral scanning are in the three test fields respectively. The reflectance data of different, ATM data, the sun reflective brightness data (on the standard plate) are acquired. The case of field synchronization measurements is in Table 1.

1 The Ground and Airborn Data Processing
The reflectances ri (l) of the different earth objects in the three test fields is computed. They are the average with a few measurements. Using relative response function Sni (l) acted as filter functions, according to equation (14), the result of rj (l)multiplied Ee (l)/p is being integrated, to acquire the efficient reflective brightness Lij of the earth objects in each band (Table 2).
The HDDT (High Density Digital Tape) is transformed into CCT, one finds out the read numbers Dij of pixel is read, and the average D of pixels selected with natural earth objects is calculated.
2 Create Relationship
According to the equation (17), by taking the ground and ATM data, the statistic regression equation is created using method of a least squares, and counts the regression and relation coefficients (8). The regression line is as seen in Fig. 5.
Fig. 5 The chart of linear regression between the ground spectral and ATM data of band 1 in flight line nine.
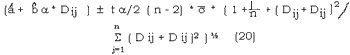
3 The Way of Error Estimation and Remarkability Examination(8), (9)
- The standard deviation estimation of Lij
- Standard deviation estimation of bi
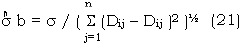
- Gama and T examination (9)
- The forcast of believability region.
Analysis of Results and Discussion
1 The Relationship of ATM and The Ground Spectral Data
In the three test fields, the relation coefficients between the six multispectral images and the ground efficient reflective brightness data are as shown in Table 3.
The distribution of relation coefficients in Table 3. is in Figure 6.
Fig. 6 The histogram of the relation coefficients distribution
One can see the relation coefficient that is greater than 0.99 have 28 with forty seven percent: the coefficients that are greater than 0.95 have total 54 with 92 percent; the coefficients that are greater than 0.93 have total 59 with 100 percent. When is 0.95 level, in the terms of examination, Gama(0.05) is shown in Table 4.
The aribitray in Table 3 is all greater than the maximum (0.878) in Table 4. thus the relationship is fairly remarkably using Gama examination. In the Table 5, the values of T e.g.,
and T(e.g, to.025 (n-2) are given. The Few T is a few times greater than To. The relationship is also very reliability using T examination. The results as above make clear powerful that the relative analysis model created on the airborn and ground data is extremely identical with practical situation.
2 Error Analysis
i.Error db of b^. The relative error db is
From Table 6, one can see; db £ 5, total 17, occuping 29 percent; db £ 10, total 46, occuping 78 percent; 10
ii. The Error dL of Lij :
The error of Lij is shown clear is drawn using believable region with a (alpha) level (in Fig. 5). In order to simple estimate the error of Lij, dL is defined
One can see few L is greater than ten in fig. 7. This is because that there is error in the field measurements. The major factors show as:
- The natural earth objects are not pure, but the Field of View (FOV) of IRIS Spectrometer is small. In the small area measurements, thought many times measurements are done, it is difficult to imitate the properties of the large area, and the airborn Dij values are just acquired on the large area(2.5 x 2.5 M2)
- The number of typical earth objects is limited. Because the DS-1268 gain level selected is big, the read numbers of some earth objects are saturation, as result; there is no meaning about them. Then the number of earth objects taken part in statistic is less.
- The Lambert properties of typical earth objects isn’t fairly ideal.
Such as the 9 flight line (height is 1 km) and 9” line(it’s 2km) 0f Anxin test field in Hebei province. Their IFOV (Instantaneous field of view) are 2.5 and 1.25 mrad (it’s unit of angle) respectively, and their gain level of each band is the same.
From the equation (19), one gets
according to above equation, from Table 7 (bottom line, one can see that Spi ti is a few times greater than Spi ‘…. The (1 km) is certainly greater than ti (2 km), and Spi of 2.5 mrad is usually greater than Spi of 1.25 mrad. Thus, that the Spiti is greater than Spi’ti" is completely identical with practical situation.
Where, one points out, in the test scheme, without making radiance and atmospheric corrections about ATM data, the regression equations are direct created by using the field synchronization measurements technique and statistic analysis method. But the comprehensive influences of atmosphere and sensor are evaluated with the analysis results, and the influence of atmosphere and sensor are not discussed respectively.
4 The Different Detection Angles Affect The Regression Coefficients
In the same multispectral image, the detection angle of the edge is different from that of nadir, and both of their path through atmosphere from earth objects to sensor is different respectively. Thus the atmospheric influence of the edge and center in the same image is different. The test program of different detection angle is arranged along the direction of scanning line.
In the Anxin county test field, the flight heights of 9” and 10” lines are all two kilometers, IFOV is 1.25 mrad, the half angle of FOV (Field of View) is 21.48 degree. The different color cloth targets are in the nadir of 9” flight line, the detection angle of them is about 4.32 degree. The detection angle of them in the flight line 10” is about 11.82 degree. The difference of detection angle is 7.50 degree.
One can se the difference of the a in 9” and 10” flight line is negligible. So is the b. This is because that the difference of detection angle in two lines is only seven point five six degree. On the satellite image, because the total FOV is 10 degree, the half FOV is about five to six degree. In this case, the different detection angles exert influences in the same image can be neglected.
Table 9. The data of the a , b and b10 / b9 in 9 and 10 flight line. Here shows the atmospheric transmittance in 9 line. The b shows the evaluation of regression coefficient in 9 line.
From the Table 9, the arbitrary b10 is all greater than b9 Except 9 band). From the equation(19), one can get transmittance(t9) is greater than t10 (gain and Spi are not change respectively). The 0 and 10 line flight heights are all one kilometer, IFOV Dis 2.5 mrad, the half FOV is 42.96 degree. The cloth targets (different color) is in the nadir if 9 line, its detection angle is 11.1 degree. The cloth targets is viewed in 10 line, its detection angle is 42.24 degree. The atmospheric path from targets to sensor in the ten line is longer than that of nine flight line, its influence of ten line is certainly bigger than that of nine line, its transmittance in 10 line is less than one of 9 flight line. Therefore the its influence at the image edge is greater than that of image center, in the same image with the detection angle variation being quite big, the brightness of image at the edge is darkened clearly.
5. Generate the Efficient Reflective Brightness Image of the Ground