| GISdevelopment.net ---> AARS ---> ACRS 1992 ---> Oceanography |
Sea surface effect in sea
surface temperature detection
Ryuzo Yokohama, Takashi
souma, Sumio tanba
Iwate University, Morioka, Iwate, 020 Japan
Iwate University, Morioka, Iwate, 020 Japan
Abstract
The sea surface effects in the sea surface temperature (SST) detection by satellite Remote Sensing were investigated by using the match-up data set composed of the NOAA-9/AVHRR brightness temperatures and the sea surface temperature by fixed buoys in Mutsu Bay. By applying the regression analysis to the data set of 390 match-ups and its standard deviation of residues was evaluated to be 0.59C. The meteorological data measured at the buoy were referred to investigate the causes of large resides. Then it was found that large residues appear under the conditions of strong sunshine or strong radiative cooling on calm days. Under the conditions, it was proved by the data of a vertical temperature profiler buoy that large temperature differences between the real sea surface of the brightness temperature and the 1m depth of the sea truth temperature of buoy. By removing the match-ups with larger error, a selected data set with 328 match-ups was prepared and the SST estimation was recalculated. The standard deviation of residues reduced to 0.34C.
Introduction
NOAA/AVHRR is a sensor for the sea surface temperature (SST), which was characteristics: the high radiometric resolution, the wide swath of view, the frequent observation cycle, etc. The atmospheric effect is a dominant disturbance in the SST observation and the split window function method is known as an effective algorithm for the correction. A split-window function (SWF) is described as
Y = X4 + b (X4 - X6) + a (1)
Where X4 and X5 mean the brightness temperatures of ch. 4 and ch. 5 respectively. By applying the regression analysis to the match-up data sets, various SST estimation functions have been proposed and their accuracy has been validated in the range of 0.6 ~ 12C (1-8).
This paper is concerned with the investigation of the air-sea interacting effects by using a match-up data set of NOAA-9 and the buoys in Mutsu Bay. It was found by referring to the meteorological data that large residues in the regression analysis appeared when there existed large differences between the air temperature and the buoy SST. The air-sea interacting effect have been suggested as another major factors of errors in the SST estimation.
Figure 1 Geographical location of Mutsu bay and the moored buoy positions.
Figure 2 The scattered diagram of the result of the regression analysis to the total data set.
Figure 3 The scattered diagramof the residue versus(X4-Y)
Figure 4 The scattered diagram of the residue versus (A-Y). A is the air temperature measured on No. 6 buoy.
Figure 5 The scattered diagram of the large residues versus( X4-Y). A large residues is assumed to large if its ablolute values is lager than 1°C.
Figure 6 SSTPB Measurement pole and the positions of temperature detector.
Figure 7 External apperances of SSTPB.
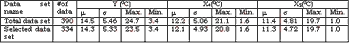
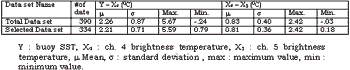
Table 1 Statistics of Data Based In The Regression Analysis
Data used in the analysis
Mutsu Bay is located in the northern end of Honshu, Japan as shown on figure 1. In the bay, there are 6 moored buoys and each buoy measures the water temperature at 1m below the sea surface, which is measured by using PRT detector with the accuracy of 0.1C at every hour. We can use these water temperature as the sea truth SST data.
Out of the NOAA-9/AVHRR data achieved fro 1985 to 1988 at the institute of industrial Science. University of Tokyo, the total number of 110 scenes were picked up as they included cloud-free buoy positions. The capes around the bay were effectively used as the control points in the buoy identification and the spatial errors could be guaranteed within 1 pixel resolution. After careful screening of cloud-free and noise-free buoy positions, the total number of 390 pairs of X4 and X5, were extracted.
A match-up was set up by combining a pair of the brightness temperature with the corresponding buoy SST at the nearest time to the satellite overpass , so that the temporal coincidence in each match-up was 30 minutes. Call this match-up data set the total data set. Its statistics are shown in table 1. The detail process for the data preparation can be referred to Yokoyama and Tanba (9).
Regression function by the total data set
The split window function of eq. (1) is calculated by regression analysis so that eq. (2) is obtained.
Figure 2 shows its scattered diagram. The standard deviation of residues (s) of 0.59C might be very small. Most of the match-ups are distributed along the perfect fit line, but some are accompanies with rather larger residues.
Residue analysis
We examined the dependency of the residues of eq. (2)upon various disturbance factors.
1 Difference between the brightness temperature and the buy SST
The amount of the air-sea interacting effect might be reflected to the difference between X4 and Y because the former air-sea defect the skin temperature and the later at the 1m depth. Figure 3 is the scattered diagram of the residues versus (X4 - Y). For the match-ups with large residues, there exists a specific dependency upon the difference. That is, large positive residues appear to small, values of (X4 - Y) and large negative residues are to large (X4 - Y).
2 Difference between the air temperature and the buoy SST
The air temperature (A) is measured on No. 6 buoy at 3m above the sea surface. The amount of the (A-Y) might be another quantity for estimating the amount of the air-sea interacting effects because it directly affects the sea skin temperature. Figure 4 is the scattered diagram of the residues versus (A-Y). Large positive residues appear to match-ups with smaller (A-Y) and large negative residues appear with larger (A - Y).
By considering that the standard deviation of residues is 0.50C, let say that a residue is large if its absolute value is larger than 1.0C. By restricting large residues, we took the scattered diagram of (A-Y) versus (X4 - Y) as in figure 5. Those seem to be distributed along a straight line. That is for the match-ups with large residues, the effect of (X4 - Y) to residues can be substituted by (A - Y).
Discussion
Table 2 is the list of scenes in which the large residues appeared. From table 2m large negative residues were restricted to the daytime data in spring and summer. The strong sunshine and the high air temperature will increase the sea skin surface temperature rapidly, but the temperature at 1m depth might be slow to respond. So that the large value of (X4 - Y) might be occurred. Under the circumstance, the buoy temperature might be overestimated and large negative residues would be probable to appear.
Large positive residues were restricted to the midnight math-ups in spring, autumn or winter. In those seasons, strong radiation cooling often occurs. Then low air temperature will cool the skin temperature first, but the temperature at 1m depth is slow to respond. So that the temperatures at 1m depth might be underestimated and large positives residues are probable appear. The data suggest that to consider the air-sea effects is very important for the reliable validations.
A special buoy to observe the vertical temperature distribution near the sea surface called "Sea Surface temperature profiler buoys (SSTPB)" was developed as shown in figure 6. SSTPB has 11 temperature detectors within + 2m and measures the temperature profile every 30 minutes. Attached with frame and float as shown in figure 7, SSTPB was set neat the No. 6 buoy in Mutsu Bay (10). July 7, 1992 was a clearly fine day. It was very calm until about 14:00 but began to blow after that, Figure 8 is the data observed and figure 9 shows the temporal changes of its vertical temperature profile. At 5:00 right after the sunrise, the profile is just straight. But there appeared about 5C difference between -0cm and -100cm at 14:00. The profile became straight again after it began to blow. On the other hand, July 4, 1992 was clearly fine but the wind was more than 7m/sec in the daytime. Them the water temperature was kept just homogeneous as shown in figures 10~11. Those show the significance of the sea surface effects in the temperature detection by the Remote Sensing. We are still continuing the observation by SSPB, and it may take several years to prove the sea surface effects more precisely.
And its scattered diagram is shown in figure 12. The standard deviation of the residues is 0.34C. which must be considerably small among the contemporarily reported results.
Conclusion
By using the observation data set in Mutsu Bay. It is shown that the air-sea interacting effects might be one of the major disturbances in the SST estimation due to the split-window method. For the selected data set , which was set up by excluding the math-ups doubted to be disturbed by the air-sea interacting effects, we got the standard deviation of residues of 0.34C.
References
- Barton, I.J., 1985, Transmission model and ground-truth
investigation of satellite-derived sea surface temperature, journal of
climate and applied meteorology, 24, 508-516.
- Deschamps, P.Y. and Phulpin, T., 1980, Atmospheric correct of infrared measurements of sea surface temperature using channels at 3.7., 11 and 12 mm, Boundary layer Meteorology, 18, 131-143.
- Llewellyn-Jones, D.T., Minnett, P.J., Saunders, R.W. and Zavody, A.M., 1984, Satellite Multichannel infrared measurements of sea surface temperature of the N.E. Atlantic Ocean using AVHRR/2, Quarterly Journal of Royal Meteorological Society, 110, 613-631.
- Maul G.A. 1983, Zenith angle effects in multichannel infrared sea surface Remote Sensing, Remote Sensing of Environment, 13, 49-451.
- MoClain, E.P., Pichel, W.G. and Walton, C.C., 1985., Comparative performance of AVHRR-based multichannel sea surface temperatures, Journal of Geophysical Research, 90, 11, 587-11, 601.
- McMillin. L. M. and Crosby. D. S. 1984. Theory and validation of the multiple window sea surface temperature technique, Journal of Geophysical Research, 89, 3655-3661.
- Robinson, I. S. and Ward N., 1989, Comparison between satellite and ship measurements of sea surface temperature in the north-east Atlantic Ocean, International Journal of Remote Sensing, 10, 787-799
- Strong, A.E. and McClain, E.P., 1984, Improved Ocean Surface Temperature from Space, ----------- Comparisons with drifting buoys--- Bulletin American Meteorological Society, 65, 138-142.
- Yokoyama, R., and Tanba, S., 1991, Estimation of Sea surface temperature via AVHRR of NOAA-9, -------- comparison with fixed buoy data ---------------------, International Journal of Remote Sensing, 12.25134-2528.
- Yokoyama R., S. Tanba, T. Souma, "Observation System for Sea surface
temperature validation Test in Mutsu Bay", 2nd International Conference
on Japanese Earth Observation Programs Proceedings of PRE ISY
INTERNATIONAL SYMPOSIUM. 57 ~ 68, 1991.