| GISdevelopment.net ---> AARS ---> ACRS 1992 ---> Geology |
Archaeological application of
Remote Sensing in Mongolia
Toshibumi Sakata,Haruhisa
Shimoda,Masahiko Etaya
Tokai University Research and Information Center 2-28-4 Tomigaya, Shibuya-ku,
Tokyo 151, Japan TEL 03-3481-0611
G. Ganzorig
Mongolia Academy of Sciences, Mongolia People’s Republic
Hiroshi Isobe
The Yomiuri Shinbun, Japan
S. Kato
Chiba University, Japan
Tokai University Research and Information Center 2-28-4 Tomigaya, Shibuya-ku,
Tokyo 151, Japan TEL 03-3481-0611
G. Ganzorig
Mongolia Academy of Sciences, Mongolia People’s Republic
Hiroshi Isobe
The Yomiuri Shinbun, Japan
S. Kato
Chiba University, Japan
Abstract
Remote Sensing can be one of an important tool for archaeological explorations, especially for countries where written ancient manuscripts are area like Mongolia. This paper describes Remote Sensing applications for Archaeological exploration in north Eastern part of Mongolia. Many kinds of Remote Sensing data like MOS-I MESS, Landsat MSS, Landsat TM, SPOT HRV, COSMOS MK-4, COSMOS KFA-1000 and JERS-1 SAR going to be used for this exploration. Important archaeological results have been obtained with the aid of ground explorations as well as Remote Sensing data analyses. This study has been conducted on the joint investigation under the Mongolian and Japanese.
Purpose of Investigation
Remote Sensing technologies, hereafter referred to RS, are effective for collecting information on the Earth’s surface in such areas as geography and geology, vegetation, oceanography and other studies covering the ground. RS from Earth observation satellites enabled gathering of detailed data in a wide range of areas thanks to development of high-resolution sensors, represented by Landsat – TM (thematic mapper) and SPOT-HRV (high resolution of the visible). The uses of RS have been increasing in the field of resources and archaeological probes.
The purposes of our research, as part of the Japan-Mongolian joint academic study called “Gurvan Gol Project”, is to create graphics information and basic data, utilizing RS technology and satellite data, necessary for the probe of the tomb of Gengh is Khan and related relies.
Investigation Project and Method
The investigation and research of the RS team in the project started with the 1989 preparatory investigation and collection of satellite data. from 1990, full-scale work was started for the RS probe, such as making maps for on t-the-spot investigations. Our investigation plans include the following works :
1. Satellite data collection and creation of ground truth (GT) maps.
2. Basic investigation and research concerning application of RS technology to the relies probe.
Work done in the initial year mainly covered collection of satellite data (still under way), creation of GT maps of the investigation area. Monogonmorit to the upper stream of the Kherlen River, and analysis of those data. These area of investigation in the initial year are shown in Figure 1.
Fig. 1. Target area
1 Creation of GT Maps
GT maps, maps made from satellite images and used for the actual investigation, are effective for comprehending the Earth’s surface information which are not on general maps or difficult to read accu- rately. Also, latest information can be obtained from the GT maps especially for areas where maps are rarely updated. Generally available maps for our investigation areas are old maps (in a scale of 1 to a 100,000) updated between 1957 and 1983 and inadequate for our on-the-spot investigations. To conduct an effective and accurate on-the-spot investigation, supplementary data such as GT maps are necessary.
Data used for making GT maps in the initial year are TM data (130 – 26) thath cover Mongonmoril to the upper stream of the Herlen River. We also obtained SPOT data (for October 1989) covering the same area before we made GT maps. However, we did not use the SPOT data as most of the area was covered with snow. We have conducted the following works to create GT maps.
| 1. | Selection of Satellites | 4. | Adjustment processing |
| 2. | Data retrieval | 5. | Image output |
| 3. | Data gathering |
1.1 Selection of Satellites
Taking into account satellite images to be used as data for our investigation, we have to decide which satellites and sensors should be used. They are decided based on the size, form and spectrum characteristics of objects to be searched. In our research, the main object is the tomb of Gengh is Khan and there is little information which can be regarded as decisive to detect the tomb. In this case it is desirable to have satellite data of high resolution that can identify even tiny objects, satellite data suitable for our research are those of the following sensors: SPOT – P (Panchromatic mode) with ground resolution capacity of as close as 10 meters, SPOT-X (mulitspectral mode) with a capacity of 20 meters. Landsat – TM (Thematic mapper) at 30 meters and Cosmos at 5 meters. Cosmos was dropped from satellite and thus we decided to use data of the remaining SPOTs and Landsat – TM.
1.2 Data Retrieval
The next step is to retrieve scenes fro previously observed data, barring scenes when the ground was covered with snow or hidden by clouds. however, no accumulated previous observation data by SPOTs and Landsat – TM covering the area subject to our investigation existed at all. As no regular observations of the area has been performed, we requested spot image co and EOSAT Co. for special observations of the area.
1.3 Data Gathering (requesting special observation)
SPOT satellites observe the same areas about 15 times annually, while Landsat observes the same areas about 40 times (when both Landsat No 4 and No. 5 are in operation). However, about 65 percent of the scenes processed by the sensors are of no use even if they are those on sunny days as the ground surface of the subject area is covered with snow form October to May. Also, it is quit unusual to acquire data of scenes with a cloud-rate of less than 10 percent since the mountains terrain of the area causes clouds to form even in non-winter times. Another problem is that, although it is essential to use SPOT data to obtain images with improves, high resolutions, 30 to 40 scenes would be necessary to cover the subject area with SPOT data and thus increase both cost and amount of data. On the other hand, although the resolution quality is slightly degraded. TM data can cover the entire subject area with six scenes. For this reason, we decided in the initial year to use SPOT-P data, monochrome but highest resolution. For especially important sections of the entire areas. The observation period when there is less snowfall.
1.4 Adjustment processings
- Noise adjustment
SPOT and TM data have regular striped noises. These noises are caused as the sensors detectors do not have a unifom sensitivity, TM data have horizontal stripe noises, whole SPOT data have vertical stripes. The process of removing the noises is called destriping major destriping methods are listed as follows :
- Space frequency filtering
- smoothing filter for actual space
- Primary conversion of image density of each detector
- Adjusting the frequency of image density of each detector.
From the viewpoint of processing time and quality, we selected the No. 4 method this time.
- Geometric adjustment
Satellite data are subject to geometric distortions cause by the satellite’s altitude, location, posture, and inequality and curvatures on the surface of the Earth. Geometric adjustment is used to remove the distortions and translate the data into topographical maps to create image data free of such geometric distortions. The following two methods are normally used for geometric adjustment.
- System adjustment that uses satellite pasture data
- Adjustment using the ground control points (GCP)
1.5 Image (GT Map) output
Latitude and longitude lines at intervals of every five degrees were inserted into the images obtained through the above-mentioned measures and GT maps on a scale of 1 to about 50,000 were output. Also as reference material, we prepared overlays for topographical maps with the same reduced scale. The entire GT amp and a sample output (size reduced by 50- percent) are shown in Fig. 2 and Fig. 3. A color laser printer was used as an output device. Usually, three primary colors (blue=B, green=G and re=R or yellow=Y, magenta=M and cyan=C) are used. Namely, data for three channels (colors) can be output at one time. therefore, it is impossible to output TM data, which have seven-channel spectrum information, at one time and we had to choose three channels out of seven. Although several different combinations of the channels could be considered, we selected B(CH1), G(CH2) and R(CH4), so called false colors. We also made a color synthesized image of the entire area with a reduced size of 1 to 100,000.
Fig. 2. Output area of ground truth map
Fig. 3. Ground truth map
Result
1 Satellite Data collected
Fig. 4 shows the observation range of collected data. The following first shows satellite data so far collected.
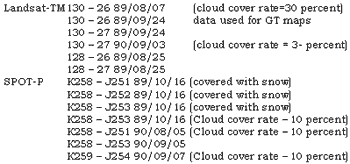
Fig. 5. The Tereljiin castle
2 Satellite Data Reading and Analysis
2.1 Reading
Reading satellite data is quite useful for understanding information not obtained from general maps, such as topography, geology, vegetation, waters, roads and artificial structures. Data reading means extracting information of target objects from their characters such as size, figure and colors (or spectrum). More accurate information can be obtained by adding information on the target area’s climate and history. TM data of Sept. 24, 1989, processed this time, were turned into a false color synthesized image with B(CH1), G(CH2), and R(CH4). In this case, objects covering the land generally correspond with colors in the following example.
Red : Trees (Conifer), farming fields with produce and grassland (green to human eyes)
Orange: Trees (broadleaf), farming fields with produce and grassland (Green to human eyes)
Pink: Farming fields with produce and grassland (light green to human eyes)
Yellow: Deciduous trees, barren fields and roofs painted red.
Green: Vacant lots, farming fields without produce and wet vacant lots.
Light blue: Concrete, dried vacant lots, shallow waters and dirty waters.
Blue: Urban areas, sand, pebbles, rocks asphalt and wet, vacant lot and paddy fields with water .
Gray: Dry vacant lots
White: Clouds and snow
Black: Deep waters and shadow
However, the above color / object correspondence is not applicable to boundaries between different coverings or areas where these objects area mixed. Also, seasonal changes on observation days should be taken into account in respect to vegetation of the trees and farming fields. Several results of the data reading are shown below.
- Most of the areas around the upper stream of the Kherlen River, the initial year’s investigation area, were mountainous and more than 80 percent were trees.
- In deciduous tree forests (red sections) with coniferous trees cover mountainous areas where at high altitudes, while deciduous tree forests cover mountainous areas at low altitude.
- Snow (white) maps most of the summits of mountains in the 2,000 – meter range. On the other hand, rock (blue) are seen around the summits of mountains with relatively less snow, including Mt. Erdenet. Several areas where landslides are believed to have taken place (blue) can be seen on the middle slopes of the mountains.
- The plains area around the village of the Mongonmorit it is mainly covered by grass fields (light red section) and vacant lots (blue or blue green sections).
- Among man-made structures, a small number of houses, a prison and other villages buildings (light blue or gray sections) can be confirmed.
- Several roads (light blue or gray sections) are confirmed in an around Monognmorit village and along the western banks of the Kherlen River.
- The plains around the Kherlen River, especially in the Bonbatyn Uzul area. Snow characteristics of several narrow branch creeks following as if tangling with each other. We believe this area is wetland with much vegetation (dark blue and red).
- There are two areas, about 0.5 by 1 kilometer and 0.5 by 0.5 meter and linear structures of several kilometers as if surrounding the two areas on the north slope of Mt. Terelji / located about 10 kilometers northeast to Mongonmorit village. From spectrum characteristics and their figures, the former may be a farm land which is almost deserted, the latter a dense grass fields or coniferous forest. However, these have not been confirmed yet.
1 Spectrum information
From spectrum information it is possible to obtain information about forms of the objects, colors and whether the objects are plants or soil. If the tomb of Genghis Khan, the object of our investigation, does not exists or if it is an underground tomb, it is quite important to check things covering the ground, especially slight differences in the surface vegetation and soil and geographic patterns considered to be artificial. From this viewpoints, TM data are useful as a wide range of spectrum data, from those visible with human eyes to those in the ultra red wave length range that cannot seen with human eyes.
2 Ground object resolution capacity
Ground object resolution capacity is the most important thing in investigations of ancient tombs using satellite data. The data lengths of roads, buildings and artificial structures in the areas of our investigation are mostly fro several meters to several tens of meters. Provided that our target, the tomb, is about the same size, it is desirable to use satellite data with high resolution capacity. Figures 5 and 6, show the side of earthen castle measuring about 280 meters square along the Terelji River southwest of Modontolgoy together with its satellite images (the size is one to about 33,00 for both TM and SPOT data) with the TM satellite image, whose resolution capacity of 10 meters. Fig. 7 shows simulation results of resolution capacity using SPOT-P data for the castle. The shape of the castle can be recognized with a resolution capacity of from 10 to 30 meters. At a resolution of 30 meters to 50 meters, the figure of the castle is unclear. It is impossible to recognize the shape at a resolution of 80 to 100 meters. Namely, the resolution capacity to recognize a ground object measuring 280 meters square is about 30 meters.
Fig 6. SPOT-P image covering the Tereljiincastle
Fig 7. The resujlts of ground resolution simulation used SPOT-P data
Conclusion
Conclusions of the initial year’s investigation and research are as follows :
- Gathering of satellite data will be continues, Especially, it is necessary to collection TM(129-26/27) and SPOT data for the Batshireet and Binder districts, and SPOT data of areas along the Tsenher Gol River as no data have been collected in those areas.
- The store of basic data is still insufficient to carryout a tomb probe (selection of prospective areas) with satellite data. It is necessary to examine how already discovered archaeological remains are reflected in satellite data and compare that data with visual data. Also, it is necessary for us to have close exchanges of information with the archaeological group.
- Results of simulation suggest that we need satellite data obtained at ground object resolution capacity of at least 30 meters, except the size of our target is considerably large.
- On TM images there are several rectangular man-made objects, especially around Mongonmorit villages. There objects are believed to be farm sites but they should be confirmed in Mongolia.
- In the next investigation year, much more accurate researches of Henti and Mongonmorit areas are scheduled, using newly obtained SPOT data (September 1900) for both areas.
- To utilize satellite data more effectively, we need a complex information system like GIS. Especially, we need a digital terrain model (DTM). To produce the best DTM, we need original topographical maps with a high degree of accuracy.