| GISdevelopment.net ---> AARS ---> ACRS 1991 ---> Water Resources |
Satellite Remote Sensing for
Surface water assessment and management of Bhopal Lake - An integrated
approach
R. K. Singh, N. V.
Deshpande, B. Sakalley, S. N. Rajak and J. Kelsy
Remote Sensing Applications, Centre M.P.
Council of Science & Technology Bhopal – 462 011, India
Remote Sensing Applications, Centre M.P.
Council of Science & Technology Bhopal – 462 011, India
Abstract
Reliable water supply to burgeoning urban population is one of the main global problem. The provision of surface water for meeting the demand requires creation of new storage reservoirs as occurrence of precipitation differs significantly from the rate of demand in time and space. Temporaral discrepancies between supply and demand can be smoothened if the water available for supply is predicted in advance. The role of Remote Sensing technique in this regard has been widely acclaimed in recent years.
Bhopal city receives water supply through lakes, especially upper Lake having catchment area of 367 Sq. km. In the present study an attempt has been made for estimating the volume and availability of water in Upper Lake using multi date MSS TM and IRS data. Periodic analysis of satellite images have facilitated in mapping the extent of Upper Lake in different seasons of the years and its volume content in conjuction with annual rainfall. Erosion prone areas within the catchment of lake were identified based on thematic informations like geology, geomorphology, land use/land cover, slope, soil etc. The study revealed the technical feasibility and utility of multidate sensed data in mapping and management of large water bodies.
Introduction
The provision of reliable water supply requires creation of reservoir as occurrence of precipitation differs significantly from the rate of demand in time and space. The role of reservoir is to smoothen the temporal discrepancies between demand and supply derived from variable precipitation to meet the varying demand patterns without waste or shortage of water, requires appropriate water assessment technique relating input precipitation to storage of water in reservoirs. An appropriate method can predict the water storage of reservoirs in real time and assess the changes to hydrologic regime of the catchment, consequent to modification of its land use (Deforestation, afforestation, urban and rural development). The collection of above information at present follows the traditional cumbersome methods, which besides being subjective and some times even biased, are manpower intensive, expensive and time taking. Remote Sensing technique has been found extremely useful in this regard during recent years.
Objective
In the present study an attempt has been made to (i) estimate the water available in Upper Lake and other reservoirs using multidate satellite data and (ii) to identify the erosion prone areas within the catchments based on thematic informations like land use, geomorphology form satellite data and existing informations like geology, soil, slope etc. So that management practices can be adopted.
Study Area
The study area is located between approximately 77°5’ to 77°25’ N lat. and 23°5’ to 23°15; E long. nearby Bhopal, the capital City of Madhya Pradesh in India. The area comprises of Upper Lake and two reservoirs, i.e. Kaliasot and Kerwa with a catchment area of 367, 17 and 69 sq. km respectively. The upper lake situated nearby the main city and lying in the midst of Vindhyalas is the prime source of drinking water. Kaliasot is located in the South Suburb while Kerwa at a distance of approximately 10 Kms. from main city in the southern part. Kolans, Kaliasot and Kerwa nalas are the main drainage sources of the area. Kolans nala is the inlet and Kaliasot, the outlet for the upper lake drainage water into Kalisasot reservoir during monsoon months. Kaliasot and Kerwa reservoirs have been constructed to meet the water demands of Bhopal city during dry seasons. The normal rainfall is about 1057 mm. with 90% of the precipitation received during the monsoon months of June to September.
Geology of the area is prominent with two rock formations : (1) the upper Vondhyans of Bhopal belonging to Bhander sandstones (2) Malwa traps constituting the middle portions of Deccan Traps. Consequently, two major types of soil are found in the area viz. (1) black cotton soil derived from Deccan trap in the plain area (2) Laterite soil with different grade and at few places somewhat sandy. Erosion occurs considerably every year in different areas of laterite by torrential rains as these areas are devoid of vegetation.
Methodology
Multidate Landsat MSS (23.1.84 and 14.11.84), TM (26.1.88 and 9.11.88) and Indian Remote Sensing Satellite (IRSIA LISS II, 3.2.91) data in the form of false color composites (FCC) were used in this study. They survey of India topographical maps on 1;50,000 scale formed the baseline data for assessing the variations of reservoir spread as well as base map for the preparation of thematic maps. All the data sets were visually interpreted based of standard photographic and geotechnical elements for the preparation of various thematic maps i.e water spread, land use and geomorphology of the study area Final maps arrived after field verification. The rainfall data was collected from PHED, Bhopal.
Results and Discussions
1. Water assessments of upper Lake and Reservoirs :
The water spread in the reservoirs during different dates is shown in Fig.1 and their areal extent in Table. 1. Based on tonal variation only two units viz., deep water and shallow water have been delineated. The deep water appeared in dark blue tone whereas shallow water in light blue to greyish tone during all the dates. In case of Upper Lake, the area under deep water was maximum on 23.1.84 and minimum on 26.1.88. However, total water spread was maximum on 3.2.91 and minimum on 26.1.88. These dates also observed the maximum and minimum shallow water area, respectively. Kaliasot reservoir also followed a trend similar to Upper Lake. Reservoir spread of Kerwa was comparable on all dates except on 14.11.84 when it was maximum.
| Reservoir | Assessment year | Water spread (Sq. km) | Rainfall (mm) of previous yrs. | ||
| Deep water | Shallow water | Total | |||
| Upper lake | 23.01.84 14.11.84 26.01.88 09.11.88 03.02.91 |
27.60 27.40 23.55 25.85 2.45 |
3.0 3.30 0.47 5.41 11.80 |
31.20 30.70 24.02 31.26 37.25 |
1368 1020 832 1019 1377 |
| *Kaliasot | 26.01.88 09.11.88 03.02.91 |
0.63 1.10 2.80 |
-- -- -- |
0.63 1.10 2.80 |
832 1019 1377 |
| Kerwa | 23.01.84 14.11.84 26.01.88 09.11.88 03.02.91 |
3.20 3.43 3.10 3.10 3.20 |
-- -- -- -- 0.10 |
3.20 3.43 3.10 3.10 3.30 |
1368 1020 832 1019 1377 |
*Reservoir contracted after
1984
A comparison of reservoir spread and total rainfall of previous years corresponding to those of images, exhibited interesting trend. For Upper Lake and Kaliasot, total water spread was maximum in the year of highest rainfall (1377 mm) and minimum in the year of lowest rainfall (832mm). Although, total water spread of Upper Lake increased with increasing rainfall, the deep water area decreased and shallow water increased over the following years. This substantiated heavy sediment load in the lake and thus reducing the storage capacity of reservoir. At maximum water level of 1666.8 ft. total water storage capacity is 3588 million cubic ft. supplying 29 lakh gallons per day throughout the year (Rathore, 1988). Since this level was achieved for the water spread in the years 1984 (23.1.1984) and 1991 (3.2.91). one may expect same amount of water available for supply in both years. But the decreased extent of water in 1991 observed from satellite data indicated deficit in water storage due to siltation of the upper lake and gradually more water discharge into Kaliasot reservoir during monsoon months.
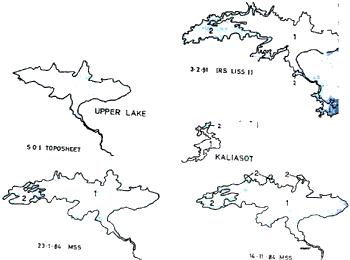
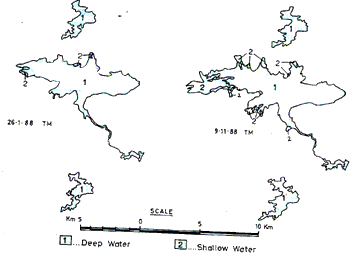
Fig 1 Temporal waterspread fluctuation in upper lake and reservoirs
2. An integrated approach for management of upper lake and reservoirs
High sediment load reaching the upper lake may be the major cause in reducing the storage capacity of reservoir as evidenced by temporal changes in water spread. Therefore, potential erosion prone areas have been demarketed for identifying the location and extent of sediment sources in the catchments on the basis of land use/land cover (fig. 2), geomorphology (fig. 3), drainage pattern (fig. 4), geology and soil of the area.
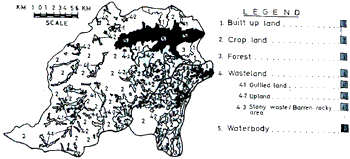
Fig 2 Landuse/Landcover in the catchments
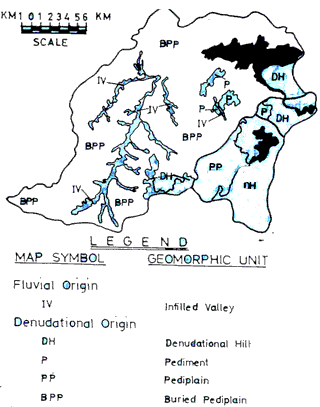
Figure 3 Geomorphology of the catchments
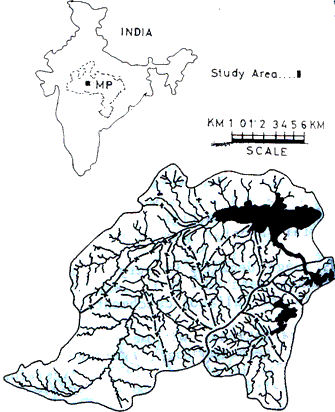
Fig 4 Watersheds in the catchments
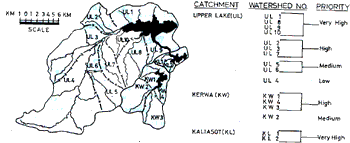
Fig 5 Prority classes of watersheds
The prevalent land use / land cover prevalent in the catchments is built-up land, crop land, wasteland, forest and waterbody. Crop land predominant in upper lake (73.22%) and Kerwa (49.775) catchments, while uplands (42.28) in the Kalisot. Forest (16.13%) dominated in the Kerwa catchments and gullied land (3.4%) were noticed in upper Lake catchments only.
Geomorphologically, the area comprised of infilled, valley, buried pediplain and denudational hills. Buried pediplain are flat to smooth composed of basalts of Deccan trap. Pediments are moderately sloping bedrocks of Vindhyan sandstones between hills and plains with deep valleys and gullies. Denudational hills composed of Vindhyan and Quartigitic sandstones are resistant to erosion. Infilled valleys are fluvial in origin consisting of boulders, pebbles and gravels.
Drainage density is very high in upper lake and medium in Kerwa and lowest in Kaliasot catchments. Consequently, watersheds are maximum in Upper Lake and minimum in the Kaliasot catchments.
The variations, within the catchments and each watershed, characterized by land cover, geomorphology, drainage and soil, influence the erosion intensity in catchment (Karale et al. 1977). Therefore, watersheds have been prioritized to show the distribution of potential erosion prone areas in each cathment. Four classes of priority i.e very high, high, medium and low are fixed (fig. 5). Out of ten watersheds in Upper Lake, only four have very high priority class on account on account of their proximity to lake and predominant agricultural practices. In the Kerwa catchments comprising four watersheds, three have very high priority as these consist of denudational hills with high relief and dendritic drainage pattern. The watersheds of Kaliasot have medium priority because this catchment area receives excess water from upper Lake.
Conclusions
Multidate satellite data can be effectively utilized in the mapping and monitoring of large reservoirs used for drinking water. The present study indicated increase in water spread area but decrease in storage capacity over the years due to siltation of upper lake. The study also concluded that satellite data can be of immense help in prioritization of watersheds in the catchments where soil conservation measure can be taken on priority basis. A large area exposed around the prepheri of upper lake in winter months should not be ploughed but maintained as tree plantation to check soil erosion and further siltation of reservoir.
Acknowledgement
The authors are grateful to Dr. D.N. Misra, Director General, M.P. Council of Science & Technology and Dr. S. Khan, Incharge, Remote Sensing Applications Centre for providing necessary facilities and permission to present the paper.
References
- Karale, R.L. Bali Y.P. and Narula K.K. 1977. Priority watersheds for soil conservation works in Matatilla catchment. J Indian Soc. Soil Sci. 25(3) : 331-336.
- Rathore, P.S. 1988, Upper Lake and Bhopal water supply. In : Proc. Nat. Symp Past, Present & Future of Bhopal Lakes, Bhopal, pp. 1-6.