| GISdevelopment.net ---> AARS ---> ACRS 1991 ---> Poster Session |
Inverse method in estimation
of surface characteristics with Radar Backscattering
Weixing Hao, Changling
Zhao
Institute of Remote Sensing Application,
Chinese Academy of Sciences, Beijing 100101, China
Institute of Remote Sensing Application,
Chinese Academy of Sciences, Beijing 100101, China
Abstract
In the interpretation of radar image quantitatively, the inversion method is an important approach from image to ground information. The characteristics of a randomly rough surface are its rms surface height, rms surface slope, surface correlation and surface permittivity. In general, to inverse for any one of the parameters from remotely sensed data is to choose appropriate polarization, frequency and incidence to get the greatest sensitivity to the interested parameter and smallest t other parameters. In this paper, three scattering models for soil surfaces in the different surface conditions are used with the multi-parameter radar scattering data to inverse the surface features such as listed above. These models were usually applied in large wave length such as L-band and C-band, rarely in X-band. We find that to large part of cultured surfaces, geometrical model are more available than physical model and perturbation model which is applied at C-band L-band availably. Since radar returns nearly only response to field water capacity in the parameters of surface texture, soil moisture is estimated with the ratio of like polarization data at incidence of 240 to 48 degree. The surface roughness and its spectrum are estimated at incidences from 0 to 48 degree. The results achieved are close to practical data when statistic is added.
Introduction
With the development of remote sensing technique, it is needed for quantitative of remote sensing, and enhancing the classify resolution of remote sensing image. In the microwave range, this will become possible during 90 with the multi-parameter radar images being offered. To extract much more ground targets information from the images, one of the key factors lies in the theoretical models which correctly display ground figures. Now commonly accepted are physical-optics model (POM), geometric-optics model (GOM) and small perturbation model (SPM) which are used to show surface characters mathematically. In the papers (1)-(2), the details of these models and their primary application are discussed. In our paper, the characteristics of bare soil will be inversed with the models combined measuring data by X-band scatterometer.
Surface information included physical and geometric characteristics can be reflected from radar images. Physical information is the dielectric of the illuminated targets which is usually domi- nated by soil moisture. Geometric information includes surface canopy, texture, surface undulation, surface correlation length and surface roughness. In another words, radar image is total reflection of these figures. In one of these figures is to be known, such as soil moisture, effects of others have to be removed. Our studies of this paper are on bare soil on which surface characteristics are mainly soil moisture, surface roughness and surface correlation length.
Usually surface theoretical models are formed by physical figure function and geometric figure function which are independent from each other. [3]

Where
 is backscattering co efficiency function,
dielectric function frt(eq) is dominated by surface dielectric, where t or r can
be horizontal (h) or vertical (v) polarization. Surface roughness function
f(r(x),q) is dominated by surface roughness, surface
correlation length, and independent of dielectric. From equation (1), it’s
very clear that polarization information is expressed by dielectric
function
  and independent of surface
roughness function. Thus the dielectric function frt(e,q) can be subtracted by
using the ratio of two polarization components and the effects of the
surface roughness f(r(x),q) can be removed.
frt (e,q) can be determined when frt (e,q) is known. Here all the surface characteristic parameters can be calculated out.
The Inversion data
We made a series of backscattering measurements with X-band scatterometer on cultured soil and bare soils in the region of Xinxiang, Henan Province of China during May to June, 1989. Then there were shower sometimes. It was just good for the measurement on the variances of soil moisture. Ground truth have been investigated at same time. The range of surface height standard deviation is 0.6 to 2.4 (cm). The soil moisture variances from Mg = 11 to Mg = 31 where Mg is moisture gravity percentage. The soil ingredients were sand and clay and S = 19.5, C=25.9, where S is the percentage of sand and C is percentage of clay. From [3] it is to be found that the values dielectric constant of the soil were from 8 to 25. The imagery part of the dielectric constants were omitted since only surface interaction was to be taken consideration. The interval of the tool like a comb structure, which are used to measure the surface height standard deviation and surface correlation relation length, is 3 (cm), therefore there were some problems for the these data validity since the X-band wave number also is 3 (cm). Especially for the surface correlation length, these observed data were invalid. Thus this information is missing.
Three theoretical models [2], [3]
Now each of these models will be given a brief description.
- Physical Optics Model
This model is derived with scalar approximation based on the Kirchhoff method. It is suitable for medium or little surface height standard deviation.

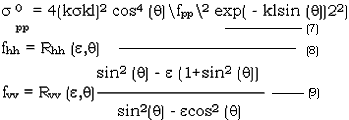
Where q is incident angle, k is wave number, Rpp is the reflectivity of a smooth surface p-p polarization, p is h or v.K0 = (2kscos(q))2, s is surface height standard deviation. 1 is surface correlation length.

where e is the dielectric constant of the soil.
The model is valid when surface correlation length is larger than one wave length a m < 0.25 where m is RMS surface slope (m = Ö2s/l).
- Geometric Optics Model
This model also is based on Kirchhoff method with stationary phase approximation. It applid the conditions of large surface height standard deviation.

- Small perturbation Model
This model can be used for small surface height standard deviation and surface correlation length. It can be expressed as follows:

where all terms are as described above.
- Program Progress
Calculation is under the optimum parameters estimation method [4] where Marquardt method that is an algorithm for least-squares estimation of nonlinear parameters is applied. Since in the whole range of surface roughness, the surface height standard deviation is high compared to the X-band wave number, GOM is more suitable to the progress. It has lower requirement for the primary values and easy to get calculation results.
But dielectric function is independent of incidences and of polarization information, while measured backscattering data do not agree with model. It means that this model do not applicable to the surface conditions completely.
Two of other models will be tried to solve this problems. Since they requires rigorous initial values, it is not easy to get results.
- Results and Analyses
Following is the inversion result using three models with back scattering data obtained under the variance soil moistures and different surface roughnesses. It was found that GOM is easy to get results with any primary values and that POM is difficult because a series sum must be done in the progress and easy to generate divergence resulting overflow. To the SPM, it is much worse for the more rough surfaces.
No. s * m e* e No. s* m e* e 1 1.85 0.68 8.0 2.25 6 2.14 0.78 10.0 2.19 2 2.16 0.70 8.0 1.74 7 2.14 0.78 10.0 1.93 3 1.26 0.78 10.0 1.61 8 0.60 0.35 13.0 4.67 4 1.85 0.72 10.0 2.22 9 1.44 0.66 15.0 4.33 5 2.10 0.80 10.0 1.66 10 1.06 0.45 25.0 37.09
Table 1. Two sets of data with * being sampled in the fields and compared with the data inversed from GOM method.
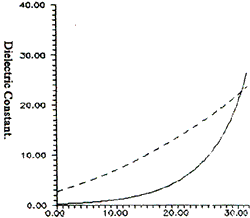
Two sets of the inversed and the observe data in fields is listed in table 1. It is very clear that agreement between the two is their change trend. In fig (1) are the curves of corresponding data sets. The attributed to the model isn’t completely expressed the ground – truth.
Another parameter m in GOM is Least-squares surface slope which is ration of surface height standard deviation to surface correlation length. Although this parameter can’t be directly compared with surface height standard deviation, their value rank is agreed with the corresponding observed data. Conclusion can still be drawn from the inversed results that the parameters calculated out with the model correctly represented the ground truth for much rough surfaces, even though without surface correlation length information and that corresponding values of the two sets are not exactly equal either. If totally quantitative of radar remote sensing is achieved, the models should be revised further more.

Fig. 1 The curves in dash line and in solid are the dielectrics transfered form (3) and calculated with GOM to the percentage of soil moisture gravity measured in the fields respectively.
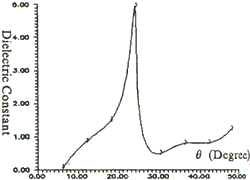
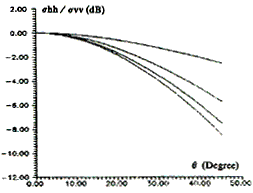
As described as above that radar return that dielectric function contributers is lower than that surface roughness function does, there are no adequate separated degree between vv and hh polarization in POM and SPM at lower incident angles. The relative dielectric constants of the targets may be smaller than that of air (e =1) which is smallest in the nature if ratio method is applied and if the difference between the two polarizations data are exceed the equation (2) allowed. There is no true resolution in this case. An interesting phenomena, however, is that there appear a peak for e at incident angle of 240. As shown in fig. (2), for example. The change of dielectric generate a small change of the ratio of the two polarization components when incidence is small as shown fig. (3)

Fig. 2 The curve displayed the dielectric calculated with method of ration o hh to vv polarization with the incidences of scatterometer.
In this paper, three theoretical models are used to inversed the surface characteristic. But only
GOM is successfully processed with backscattering data. Inversed results are close t the ground truth. This is partly because the surfaces are more rough at X-band than that at C,L and P-band, and GOM’s requirements are easy to meet. Another reason is that there only parameters in GOM and easy to find fitting function and its optimum parameters which characterized the ground targets. But it is just not lucky like this for POM and SPM. Harsh initial values demand may be made the two models worthless for practical purpose.
Since the radar return that dielectric function contributes is less than that surface roughness does, there is no adequate sensitivity the method of ratio of two polarizations. At 240 or so, it is a good region for this method being applied if more exact backscattering data are acquired.

Fig. 3 The curve expressed the backscatter coefficient ratio of hh to vv polirization with different dielectric constants.
A primary method in the paper is proposed that is addressed to extract surface roughness characteristics from multi-incidence radar images. It now be applied to bare soil where only surface scattering is occured. Further study will be aimed at the more complicated surface types with vegetation company where body scattering and absorbing are generated.
References:
- E.T. Engman, J.R. Wang, “Evaluation Roughness Models of Radar Bascatter”, IEEE Trans. Geosci. Remote Sensing, Vol. GE-25, No. 6, pp 709-713, 1987.
- F.T. Ulaby, R.K. Moore, A.K. Feng, “Microwave Remote Sensing”, Vol. 2, Addison – Wesley, 1982.
- F.T. Ulaby, R.K. Moore, A.K. Feng, “Microwave Remote Sensing”, Vol.3. Addison – Wesley, 1982
- D.W. Marquardt, “An Algorithm for Least-Squares Estimation of Nonlinear Parameters”, J. SIAM, Vol. 11, No. 2, pp 431-441, 1963.