| GISdevelopment.net ---> AARS ---> ACRS 1991 ---> Oceanography |
Evaluation of Landsat TM and
Spot data for shallow water Bathymetry
K. Abduallah, K. Mohd
Dimyata, A.P. Cracknell, R.A. Vaughan
Department of Applied Physics and Electronic
& Manufacturing Engineering, University of Dundee
Dundee DD1 4HN, Scotland, United Kingdom
Department of Applied Physics and Electronic
& Manufacturing Engineering, University of Dundee
Dundee DD1 4HN, Scotland, United Kingdom
Abstract
The feasibility of using SPOT and Landsat TM data for bathymetri studies on coastal areas near Qatar and the United Arab Emirates has been investigated. We have used one SOPT and two TM sets of data purchased for our use by the Hydrographic Department of the Royal Navy. The applications of single band, two band ratio and three-band hybrid and principal components methods has been investigated. Accurate geometrical rectification of each data set was first performed. Test areas were selected for the calibration of depth-intensity algorithms for each data set using known sounding points. The algorithm was first tested with other known sounding points. The algorithm was first tested with other now sounding points within the test area and then used for two previously unscrewed areas with each data set. The investigation showed that new information about the depth of the water in relatively shallow areas can be obtained from these types of satellite data.
Introduction
Although accurate measurements of water depth can be achieved by using conventional shipboard sounding techniques, such a survey is slow and expensive. To maintain a chart series in an accurate, adequate and up-to-date condition is an immense task to the hydrographers. As a result, investigators have become interested in the application of remotely-sensed data for hydrographic charting. The successful application of passive remote sensing techniques to this problem is restricted to shallow, clear water areas with small changes in bottom types and free from atmospheric contamination.
Algorithms for water depth mapping in coastal areas using satellite data were developed by Lyzenga (1978, 1981, 1985), Paredes and Spero (1983) and Spitzer and Dirks (1987). The principal components approach in bathymetry was developed by Lyzenga (1978).
In the present work the direct use of the algorithms, using single band, 2-band ratio and 3-band hybrid methods, and a principal components analysis approach were investigated in the coastal areas of Qatar and the United Arab Emirates. The potential use of these types of satellite data was tested in two selected previously unsurveyed areas.
Data for the Area Under Investigation
The SPOT scene and two TM scenes that we used were acquired on 2 June 1986, 13 October 1987 and 11 August 1988 respectively. The tidal data related to the scenes and the bathymetric charts were also supplied by the Hydrographic Department of the Royal Navy. Data on suspended sediment concentration, bottom composition materials and other related oceanic parameters were not available for reference.
Algorithm Description
The single band method employed in this work is based on the simple water reflection model (Lyzenga 1978). According to this model the radiance in a single band can be written as
Where ki is a constant which includes solar irradiance, the transmittance of the atmosphere and the water surface and the reduction of the radiance due to refraction at the water surface, Lsi is the radiance observed over deep water, RB is the bottom reflectance, Ki is the effective attenuation of water, f is a geometrical factor to account for path length through water and Zi is the water depth.
Rearranging Eq. 1 for a water depth determination algorithm gives
Where C1i = KiRB, C2i = Ls1 and C3i = Kif
By defining Xi = 1n (Li – Lsi), the water depth, Z (determined with data from all the bands), can be written as a linear combination of logarithms of the radiance (Paredes and Spero 1983)
Where n < 3 in this case, and b0, b1…bn are the regression coefficients.
Eq. 3 is based on the hypothesis that the bottom reflectance and the water composition remain constant within the major part of the image and that the signals in all three bands are influenced by the bottom reflection.
The 3-band version of Eq. 2 (ibrahim 1989) is
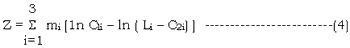
Where mi is the coefficient to be determined, and the C1i etc. were previously obtained from regression of Eq. 2.
Data analysis and Results for Spot and the first TM data set
For each data set, two test sites were selected for our analysis. The selection of the study areas was based on the availability of good spatial distribution of ground control points with a large number of depth sounding points. Each test area of the imagery was geometrically corrected by rectifying to the corresponding bathymetric chart of the chosen area using a second-degree polynomial transformation.
Depth sounding points were extracted from the chart and their locations were transformed into image coordinates. Pixel values at these points were then obtained for bands 1, 2 and 3. The respective tidal
Data were used to determined the water height during data acquisition. We replaced Xi by Li in Eq. 3 for our multiband algorithm.
And Eq. 5 was extended to form a second-degree polynomial equation.
A regression analysis was performed to calculate the optimum coefficient values in each intensity-depth algorithm considered. Points having high residuals were discarded to minimise the rms error.
The equation with the least rms error was selected as the optimum algorithm for depth calculation. The analysis reveals that data from TM test areas favoured Eq. 4. The optimum algorithm for SPOT data ws characterized by Eq. 6. For the case of polynomial algorithms, better results were produced by the second-degree equations as compared to the first-degree equations.
The accuracy of the calibration was assessed by using other known depth points within the test area. The results were displayed in the form of scatter plots of computed depths verses depths from chart and the correlation coefficients determined (Fig. 1). Water depth contours for
All test areas were derived by density slicing of band 1 and band 2 images.
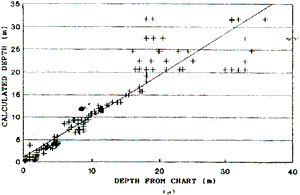
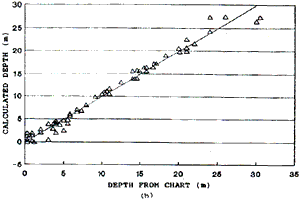
Fig. 1. Scatter plots of depth form chart vs. computed depth. (a) Area B using first TM data set [Eq.6]. Mohd Dimyati 1990
The algorithm was then used for mapping the two previously unsurveyed areas with each data set. SPOT data produced encouraging results. New depth information was obtained for the previously poorly surveyed area. The suggested bathymetric chart for the unsurveyed area was then extracted from the corresponding density-sliced image (Fig.2).
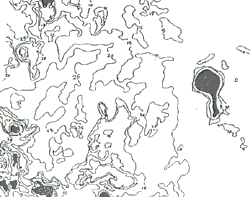
Fig. 2. Bathymetric map derived form band 1 SPOT image of the unsurveyed area 1. The scene centre location is at latitude 24° 31' N and longitude 52°8' (Mohd Dimyati 1990)
Data analysis and Results for the second TM data set
The results from the first TM scene were disappointing and it was for this reason that the second TM scene was acquired. Analysis of this TM data was conducted in a similar manner to the earlier data set. The values of the deep water radiance for each band from this shallow water region were obtained from the regression coefficients of Eq. 2.
Analysis of the single-band method for the second TM data reveals that better results were obtained with the band 2 wavelength. This might be due to the bottom material having better reflectance in this band. Regression results of the 2-band method produced a positive band 1 coefficient and a negative band 2 coefficient. The effect of the occurrence of opposite sings is to minimise the influence of variable bottom conditions on the predicted depths (Tanis and Halada 1984). From the overall regression analyses, Eq. 4 seems to offer better accuracy.
An attempt to merge all data points from all test areas for a single calibration did not produce a good result. The errors might be due to a large spatial variation of environmental parameters over the entire scene.
The capability of the use of principal components in bathymetric work was investigated. The transformation Xi = 1n (Li-Lsi) was computed for each calibration data point from band 1 and band 2. Variation of X2 against X1 was plotted (Fig. 3). The principal components Y1 and Y2 were obtained in the usual way.
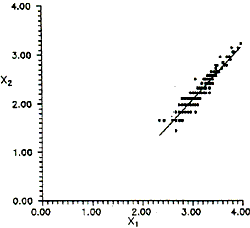
Fig. 3. Plot of x2 vs. x1 for test area 1
The regression analysis was then performed by using the equation relating water depths and the transformed coordinates values (Hengel and Spitzer 1991)
Where j is the pixel number and a and b are the regression coefficients. Results of the analysis using this technique were also encouraging.
We also attempted to use a linear stretch technique for contrast enhancement and to minimise the rounding errors during computation. The calibration regression for each algorithm considered before was again repeated using the new computed pixel values. Only a slight improvement in the calibration accuracy was achieved by this method for some of the multiband algorithms.
The analysis of the data from the second TM scene produced more encouraging results in mapping the unsurveyed area 2. A significant amount of bathymetric information can be observed on the depth contours derived from a density – sliced image of band 1 of the area (Fig. 4).
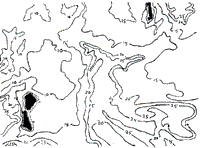
Fig. 4. Bathymetric map derived form TM band 1 image of unsurveyed area 2 (second data set). The scene centre location is at latitude 24°17' N and longitude 52°10'W.
Conclusion
The use of multiple band regression is superior to the exclusive use of any single band. Better accuracy is expected in the multiband algorithms if the statistics of the deep water radiance in all the bands considered are known. The residuals generally increase with depth in all cases and therefore it is necessary to include an estimate of depth measurement errors in the least squares regression to minimise inaccuracy at high values of estimated water depths.
Mapping of an unsurveyed are using passive remote sensing data will be successful if the calibration is performed (a) in a nearby test area in order to minimize any large spatial variation between these areas or (b) in an area having similar environmental conditions to the area to be mapped. As far as our analysis is concerned, TM data has the same capability and reliability as SPOT in bathymetric work.
Acknowledgements
SPOT and TM CCT tapes, the Admiralty Hydrographic charts and the tidal data were supplied by the Hydrographic Department of the Royal Navy, Taunton. The analysis of the second TM scene was carried out as part of a PhD project by K. Abduallah on leave from university Sains Malaysia.
References
Hengel, W.V., and Spitzer, D., 1991, Multi-temporal water depth mapping by means of Landsat TM. International Journal of Remote Sensing, 12, 703-712.
IBRAHIM, M., 1989, Use of satellite and aircraft data for bathymetric studies. PhD Thesis, University of Dundee.
Lyzenga, D.R., 1978, Passive remote sensing techniques for mapping water depth and bottom features Applied Optics, 17, 379-383.
Lyzenga, D.R., 981, Remote sensing of bottom reflectance and water attenuation parameters in shallow water using aircraft and Landsat data. International Journal of Remote Sensing, 3,71,82
Lyzenga, D.R., 1985, Shallow water bathymetry using combined lidar and passive multispectral scanner data. International Journal of Remote Sensing, 6, 115-125
Mohd Dimyati, K., 1990, Batymetric studies using SPOT and Landsat Thematic Mapper. MSC Thesis. University of Dundee
Paredes, J.M, and Spero, R.E. 1983, Water depth mapping from passive remote sensing data under a generalized ratio assumption. Applied Optics, 22, 1134-1135
Spitzer, D., Dirks, R.W.J., 199987, Bottom influence on the reflectance of the sea. International Journal of Remote Sensing, 8, 279-290
Tanis, F.J., and Halada, W.A., 1984, Evaluation of Landsat Thematic