| GISdevelopment.net ---> AARS ---> ACRS 1991 ---> Land Use |
The Development of Land Use
Classification Method Combining Remote Sensing Data with Geographical
Data
Tim R Mc Vicar, David LB
Jupp, Joe Walker
CSIRO Division of Water Resources, Canberra, Australia
Ryoichi Kojiroi, Masanori Koide, Tokio Mizuno
Yasushi Shimoyama, Tsutomu Otsuka
Photogrammetric Research and Development Office
Geographical Survey Institute
Kitasato – 1, Tsukuba – shi, Ibaraki – Pref., Japan
CSIRO Division of Water Resources, Canberra, Australia
Ryoichi Kojiroi, Masanori Koide, Tokio Mizuno
Yasushi Shimoyama, Tsutomu Otsuka
Photogrammetric Research and Development Office
Geographical Survey Institute
Kitasato – 1, Tsukuba – shi, Ibaraki – Pref., Japan
Abstract
In the study of on land use survey in the tropics, we had developed the image registration method using multi-season and multi-sensor Remote Sensing data in order to survey land use accurately, and gotten satisfactory results. However, we were not satisfied with the results of the land use classification. To exclude such misclassifications, we have developed the land use classification method combining Remote Sensing data with geographical data. The process of the classification method is as follows.
- Geometric correction, collection of training samples and calculation of statistics.
- Understanding of relationship between the land use category and geographical information and preparation of the reference table.
- Combination of the result by the maximum likelihood method with the geographical data.
Introduction
The geographical survey institute (GSI) has studied the land use classification method using multi-season and multi-sensor Remote Sensing data in the tropical area. In the 11th Asian Conference on Remote Sensing, we made a report on the image that brought us good results. However, there were many unacceptable misclassifications, when we classified the whole test site. For example, the shaded areas of forest in the mountain area were classified to the category of the mangrove forest. The shallow marine areas were often classified to the category of the city. This reason is that Remote Sensing data is not the land use information itself, but the spectral characteristics of matter on the ground. So far as we use Remote Sensing data only, we can not detect the difference among the matter which have the similar spectral characteristics.
As a solution for this problem, there is a classification method combining Remote Sensing data with other data, especially geographical information. Because the geographical information including the topographical and geological data is support to be very effective for the land use classification, we have developed the classification method using the geographical information. In this paper, we describe the classification method combining Remote Sensing data with geographical information which was developed for accurate landuse survey. The land use classification method combining Remote Sensing data with geographical information
Point of view
Until now, the classification method using geographical data in GSI was that after the classification using Remote Sensing data, the result was reclassified, referring to geographical data. However, there was a weak point in the classification method. After the classification, if land use of some areas was not in accord with the geographical data those areas were looked upon as misclassified areas; therefore the criteria of renewal depended on the using geographical data only. After all, we did not get the final result in which Remote Sensing data was made the best use of.
In this study, we have developed the new classification method to improve such a situation. In the new method, in order to make the best use of Remote Sensing and geographical data, the likelihood calculated from Remote Sensing data is combined with the occurrence probability of each category under each geographical condition such as elevation, inclination, soil and so on. Each occurrence probability is set up through human’s experience, knowledge, and so on.
Process of classification
The process of the classification is shown as follows :
- The registration and geometric correction The image
registration and geometric correction of multi season and multi-sensor
data are carried out.
- Selection of training area
The training areas are selected using the image on the display, topographic maps, and so on. The training sampled are taken from those areas.
- Calculation of statistics in the training samples.
Mean, variance and covariance of the training samples are calculated.
- Tentative classification
If it is necessary to know the geographical feature of the area, the tentative classification is carried out.
- Comprehension of relation between geographical data and land use
category.
The comprehend the relation, we can use the result of (4), the investigation at the place, and human’s experience and knowledge.
- Preparation of reference table between land use category and
geographical items.
The reference tables are prepared on the basis of the results of (5). Each element of the reference table is the possibility of the existence for each category under each geographical condition. If a pair of a category and a geographical condition show zero in the table the pixel under that condition is not classified to that category. The table and 2 are the reference tables of the elevation and inclination respectively.
- Classification by maximum likelihood method and combination with
geographical data.
As each element in the reference table is the occurrence probability, we need to adopt the classification method of Remote Sensing data that make use of the probability, in order to combine both. In this study, maximum likelihood method is combined with the element in the reference table by a method as mentioned 2.4
- Final result
The final result of the new classification method is output.
| Elevation | |||||||
| 0 m | 1–15m | 16–25m | 26–50m | 51–100m | Over 101m | ||
| Land use category | Urban
area Paddy Rubber Coconut Forest Mangrove Tin mine Water area |
1 1 1 1 1 100 1 100 |
20 70 100 35 20 100 30 100 |
10 60 100 20 50 100 20 100 |
5 20 100 5 50 50 10 100 |
1 1 100 5 100 1 5 100 |
1 1 100 1 100 1 1 50 |
Table 2 :The reference table of inclination and landuse categories
| Elevation | |||||||
| 0° | 1-2° | 3-8° | 9-16° | 17-35° | Over 35° | ||
| Land use category | Urban
area Paddy Rubber Coconut Forest Mangrove Tin mine Water area |
100 100 100 100 80 100 100 100 |
100 100 100 100 80 100 100 100 |
100 50 100 100 80 20 100 100 |
80 1 100 80 100 1 100 100 |
50 1 100 50 100 1 80 80 |
50 1 80 50 100 1 80 80 |
Maximum likelihood method
In this study, the classification method is the maximum likelihood method, which assume the normal distribution of the multi-band data. The probability that the observation value of X belong to the category i, is as follows:

åi : Variance and covariance matrix of category i
Mi : mean value of category i
n : number of bands
The man, variance and covariance matrix is calculated from the training samples. The Pi for every category in a pixel s calculated, a pixel is classified to the category of which the Pi is maximum. In the maximum likelihood method, every pixel is classified to a category in the same way.
We can omit the invariable part in formula 1

Combining method
In this study, we adopt the product as the combining method. The occurrence probability combining the result of the maximum likelihood method and the reference table is calculated by formula 3

Ai : Occurrence probability
BL,ij : possibility of land use i in category j of geographical Information L
The pixel is classifed to the category of which Ai is maximum
Case Study

Study area
The study area for the new method is Phuket Island which is located in the southern region of Thailand (figure 1). The topography of the area is the mountain range, covering by tropical rain forest and associated with granitic and limestone outcrops with a few flat landscapes. Existing land use are mainly para rubber plantation and tin mining.
Used data
- Remote Sensing Data
The name of sensor, the band and the observation date of the used Remote Sensing data are as follows :
SPOT HRV 1,2,3 Band 13 Sec Dec. 1988 LANDSAT TM 1,2,3,4 Band 6 Feb. 1989 MOS-1 MESSR 1,3,4,7 Band 4 Feb. 1989 LANDSAT MSS 4,5,6,7 Band 20 Apr. 1987
- Geographical Information
The elevation data inclination data, geological data and soil data are used as geographical data.
Elevation data : The DTM data obtained from 1/50000 scale topographic map.
Scale topographic map : The data obtained from the elevation data.
Inclination data : The data obtained from 1/250000 scale geological map.
Soil data : The data obtained from the 1/50000 scale soil map.
- Result of the classification
The results of the classification are shown in the figure
- The accuracy of the classification of the rubber is improved. By the method using the Remote Sensing data only, the rubber areas are often misclassified to the forest or coconut areas.
- The accuracy of the classification of the mangrove is improved , especially there is no misclassification to the mangrove area in the mountain range by the new method.
- The mangrove areas along the coastal line, which is classified to the urban area by the method using the Remote Sensing data only, are classified correctly.
Conclusion
We verified the new classification method improved the accuracy of the land use classification in the tropical area. Moreover, the distribution pattern of the land use by this method becomes quite similar to the real pattern.
We are anticipating that the result of the land use classification will be more accurate, if we can use various geographical information much more.
Acknowledgements
We wish to express our greatest gratitude to the researchers of the National Research Council of Thailand (NRCT) and Land Development Department (LDD) for their grate cooperation in this study through the joint project. Also, we would like to give our special thanks to the Science and Technology Agency, not only for affording us a large amount of budget, but also for assisting our joint project from all sides.
Reference
Shimoyama, Y., Kamiya, I., Koide, M., Mizuno, T. (1990) The study on land use survey in the tropics using multi-season and multi-sensor Remote Sensing Data, Proceedings of 11th ACRS Vol. II
Note :
- “Others” in the result of investigation is the land use area which is not classified to any category in the classification, such as grassland and so on.
- The accuracy of the classification is a total of elements having the correspondence between both.
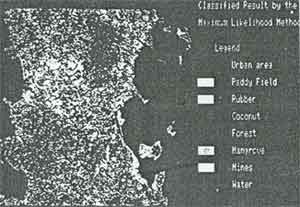
Figure 2-a Land use map using mulit-season and multi-sensor data
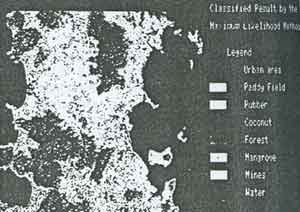
Figure 2-a Land use map using mulit-season and multi-sensor data
Table 3 The error table of classification (using no geographical data)
| Result of classification | ||||||||||
| Urban | Paddy | Rubber | Coconut | Forest | Mangrove | Tinmine | Water | Total | ||
| Result of investigation | Urban Paddy Rubber Coconut Forest Mangrove Tin mine Water Others |
0.46 0.12 2.14 0.02 0.95 0.31 1.46 0.86 0.21 |
0.13 0.51 1.46 0.02 0.20 0.18 0.27 0.04 0.03 |
0.01 0.02 4.01 0.00 1.15 0.02 0.03 0.00 0.01 |
0.09 0.30 6.63 0.11 3.17 0.14 0.35 0.03 0.12 |
0.04 0.23 8.87 0.05 16.10 0.64 0.26 0.26 0.13 |
0.01 0.00 0.22 0.00 0.58 1.64 0.02 0.43 0.02 |
0.12 0.02 0.39 0.01 0.19 0.02 1.42 0.08 0.05 |
0.00 0.00 0.03 0.00 0.09 0.07 0.08 42.32 0.02 |
0.86 1.20 23.75 0.21 22.43 3.02 3.89 44.02 0.59 |
| Total | 6.53 | 2.84 | 5.25 | 10.94 | 26.58 | 2.92 | 2.30 | 42.61 | 99.97 | |
| Result of classification | ||||||||||
| Urban | Paddy | Rubber | Coconut | Forest | Mangrove | Tinmine | Water | Total | ||
| Result of investigation | Urban Paddy Rubber Coconut Forest Mangrove Tin mine Water Others |
0.17 0.00 0.14 0.01 0.01 0.00 0.22 0.01 0.02 |
0.02 0.56 0.82 0.01 0.03 0.07 0.08 0.01 0.02 |
0.13 0.36 14.81 0.08 1.90 0.11 0.22 0.01 0.09 |
0.09 0.21 1.59 0.06 0.14 0.16 0.51 0.02 0.14 |
0.24 0.05 5.73 0.05 19.92 0.04 0.65 0.13 0.06 |
0.00 0.00 0.20 0.00 0.22 2.58 0.12 0.08 0.10 |
0.20 0.02 0.45 0.01 0.13 0.01 2.05 0.01 0.06 |
0.01 0.00 0.02 0.00 0.08 0.05 0.04 43.76 0.05 |
0.86 1.20 23.76 0.22 22.43 3.02 3.89 44.03 0.59 |
| Total | 0.56 | 1.60 | 17.62 | 2.78 | 26.58 | 3.20 | 2.88 | 43.96 | 100.00 | |