| GISdevelopment.net ---> AARS ---> ACRS 1991 ---> Forestry |
Integration of Remote Sensing
and GIS for heat island mapping: a case study of Singapore
Janet E.
Nichol
Department of Geography
National University of Singapore, Singapore 0511
Department of Geography
National University of Singapore, Singapore 0511
Abstract
Ground Surface Temperatures for Singapore derived from LANDSAT Thematic Mapper thermal band are seen to be related to differences in generalized categories of land cover. The relationship was examined for two contrasting types of environment: primary and secondary rain forest in Singapore’s central water catchment area, and high density municipal housing estates, using the spatial analysis capabilities of a GIS. Implications for possible landscaping policy in housing areas are apparent from the intimate spatial relationship between temperature and biomass.
Background
Studies of Singapore’s climate indicate significant temperature differences corresponding with land cover type (Singapore Meteorological Service, 1981) and heat island which reaches its greatest intensity around 10pm to midnight. However, satellite-derived thermal data record surface temperature, for whch rural-urban differences are said to be greatest during the daytime (Roth & Oke, 1989).
Although satellite derived radiance values can readily be converted to equivalent black body temperatures, using Planck’s constant (0), this usually underestimates Surface Temperature in warm humid atmospheres, and a correction using atmospheric data should be made if available. A further correction for emissivity is required, to obtain actual Surface Temperature.
The main factors prompting this study was the potential offered by the high resolution of the LANDSAT TM thermal band for evaluating temperature differences in Singapore’s urban, thus heterogeneous landscape, due to differential emissivities of land cover types. This has implications for landscaping policy in controlling the having environment.
The objectives of thThe objectives of the study are to examine the nature of the relationship between temperature and land cover for two specific land cover tpes in singapore. These are :-
STUDY AREA 1. The Rain Forest Nature Reserves.
STUDY AREA 2. Singapore’s high rise municipal housing estates.
The Study Areas
Study areas I comprises the central portion of Singapore island containing the Central Catchment Area Nature Reserves (Figure 1) and bounded on all sides by major trunk roads. This area totals 60 sq km of forest, reservoirs, and some urban and suburban development. Within the forested area, but separated from it by an expressway, is Bukit Timah Nature Reserve. Concern has been expressed about the future regeneration status of this reserve due to its small size and isolated state.
Study area 2 is fragmented in nature, as it represented nine of Singapore high density municipal housing estates, located to the east of the Central Catchment Area. The estates are spatially adjacent but are of varying size, age and proportion of built-up area. Population density averages 37,5000 per square kilometer, in a combined area of 17 sq. km.
Calculation of Surface Teperature form Satellite Data
The source of temperature data was a 24.5.89 LANDSAT TM image, whose then band, at 10.4-12.5m as a spatial resolution of 120 metres.
Band 6 radiance was converted to Black Body Equivalent Temperature (BBS ) using a quadratic conversion (Malaret et al, 1985). Relative temperature differences over small areas of the same cover type are accurate to a now equivalent temperature difference for TM6, of 0.50Cm (Gibbons et al 1989).
Study area 1
Emissivity correction for study area I was carried out by visual interpreting broad land use categories on a False Colour Composite image a screen digitizing the boundaries as a vector overlay. The digitized poly were then rasterised, and pixels weighted according to emissivity of the land cover class. This GIS layer was then ratioed with BBET to product Surface Temperature (ST) as follows:-
Surface IR emissivity estimates are based on published values due to difficulty of obtaining local data for forest canopy and mixed land uses.
Forest (primary rain forest and high secondary forest) .99
Water surfaces (mainly catchment reservoirs) .98
Suburban areas (incl. grass and dispersed residential) .92
Urban areas (densely built sites and high density ” ) .88
(Compiled and interpolated from Curran, 1985: Balling, 1988 & Morgan, 1977)
Study area 2
Due to the sub-pixel size frequency of the land cover types within the high density municipal housing estates in study area 2, associated temperature patterns were too detailed to be converted to vector polygons. Thus, analysis was carried out using as raster GIS, IDRISI. Conversion to Surface Temperature according to land cover was carried out on a pixel by pixel basis using a FORTRAN program to execute Equation 1. ………. main classes of land cover were recognized. Areas comprising high rise apartment blocks and associated hard surfaced walkways, roads and car parks ….. classified as non-vegetated surfaces. The remainder, comprising grassy surfaces bordered by ornamental shrubs and trees, were classed as vegetated. These could easily be differentiated on LANDSAT TM reflective bands.
Thus, in the absence of a detailed map of green biomass, or aerial photographs, in order to correct for emissivity, a density sliced vegetation index image (1) was used to produce a Geographic Definition file. (In this case, areas of different vegetation status were defined as a mask, (Fig. 6). Pixels in this file representing vegetated surfaces were given the emissivity value, 0.98 and those representing non-vegated surfaces were given the value 0.89 (2). Surface temperatures for the nine estates were obtained by rationing this with BBET n Equation 1. It is notable that this method effectively increases the spatial resolution of thermal data from 120m to the 30m pixel size of the TM visible wavebands. Mean ST for each estate was then derived using the Extract module in IDRISI.
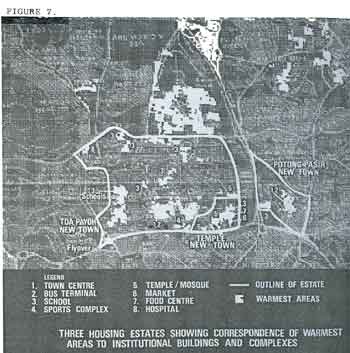
The Surface Temperature image was geometrically corrected to a base map which had been scan digitized, thus allowing the data to b related to specific buildings and building complexes within the housing estates (Fig. 7).
Data Analysis
In study area 1, Surface Temperature was compared with other types of thematic data in the form of existing ARC-INFO polygon coverages of Singapore Central Catchment Area by converting the TM data to vector format. The resulting coverage was synonymous with an isotherm map, having temperature characteristics homogeneous across each polygon (Figure 2).
Four individual polygon coverages, representing High Forest, Water (Catchment Reservoirs), urban areas, and Elevation, were each overlaid with the temperature data, to produce attribute files describing the thermal characteristics of each thematic land cover type. Visualization of given ranges of temperature for the different land characteristics was accomplished by querying across overlays either in ARCPLOT, or by downloading data to a spreadsheet package for output in graphic format eg. Figure 3 shows areas of forest temperature extremes, and Figure 4 gives the breakdown on an areal basis, of forest, water and urban temperatures.
In study area 2 the boundaries of the nine housing estates were screen digitized from a TM false colour composite image to create a polygon overland which, when rasterised, provided a Geographic Definition File (or spatial mask) (Figure 6) for the production of data summaries using the IDRISI Extract programme. Data attributes for these polygons are stored in Database Attribute File, and include Mean BBET, Mean ST, Estate area, …...% Built-up area, and a Leaf Area Index (LAI) value (Table 1). This latter is derived from field data collection.
Results
(i) Study Area 1
Notably, the coolest areas in the vicinity of the Nature Remote Sensing correspond to either high forest or water bodies which together comprise the majority of the land cover.
Figure 3 indicates substantial interior forest microclimate, with the coolest areas buffered in most instances by a broad belt of slightly warmer forest or water body. The two southernmost outliers of these cooler interior areas, to the north-west of Macritchie Reservoir, adjoin a golf course and military installations respectively, where temperatures appear to be approximately 20C warmer.
Topographically the Central Catchment Area is divided into northern and southern sections by the central lowland containing the Pierce Reservoirs and the upper Kallang Valley. Additionally, a combination of reservoir and golf course development has split the forest cover into these two sections although a cool temperature bridge is maintained across this lowland area by the water body.
The loss of the cool forest microclimate generally in the forested areas to the south of the Pierce Reservoirs, appears to be due the loss of the protective forest buffer: to golf courses in the north-east and south, and to Ministry of Defense installations around Upper Pierce Reservoir to the north-west, thus creating an edge effect in more than two thirds of this region. The two outlying cool temperature polygons, south of Pierce Reservoir: 58.5 and 70 hectares in size respectively may not be large enough to maintain their cool interior climate if further disturbance, albeit of a minor nature, were to occur to the surrounding environment and further succession to primary forest would be prevented.
Small interruptions in the forest canopy can be detected as points or ridges of higher temperature. For example, it is clear that micro climatically, Bukit Timah Nature Reserve is distinctly separated from the rest of the nature reserves in the Central Catchment Area by a narrow ridge of high temperature at least 1 C higher than that of the surrounding forest environment (Figure 3). This is due to a 70 metre wide expressway. Even such a narrow break in canopy may constitute a serious threat to the forest microclimate since it creates an edge effect whereby warmer and drier air may penetrate considerable distances into the forest.
(ii) Study Area 2
Surface temperatures were found to vary little between individual housing estates (Table 1), with a range of only 1.5 0C. Figure 5 illustrate a close negative relationship obtained between Surface Temperature and LAI (r = -0.73) suggesting that the presence of green biomass may effectively lower temperatures in this type of high density residential environment. This is further supported by the fact that the three warmer estates, Hougang,. Bishan and Serangoon North, are not spatially adjacent, (Figs. 5 & 6) suggesting that local, micro-scale, factors at the site play a more significant role than broad, meso-scale temperature patterns.
The nine housing estates studied appear distinctly cool relative to some adjacent ‘hot spots’ such as Serangoon Garden Estate and Sing Ming Industrial Estate, and contain considerably sized cool islands.
Within the estates temperatures appear to be closely related to the attributes of the immediate site. Figure 7 shows areas in 3 housing estates with Surface Temperature above 32.20C (1 Standard Deviation) and identifies buildings and building complexes which are particularly warm. The warmest areas appear to correspond to town centre commercial complexes, schools, hospitals, bus terminals, sports complexes, markets and food centres, with schools overwhelmingly represented. These sites may be either central or peripheral in the housing estate. They comprise low rise buildings and building complexes often separated by extensive barren patches of concrete corresponding to car parks, playgrounds in the case of schools, and forecourts in the case of bus terminals.
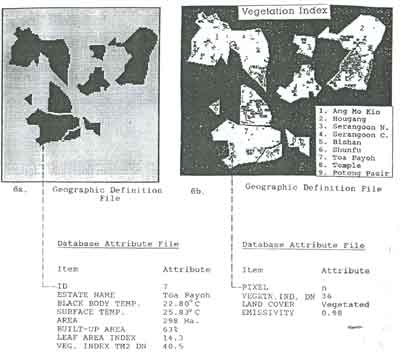
Figure 6. Geographic Definition file and Database Attribute
File . 6a. Estate polygons with associated attributes.
6b. Vegetation Index image used as a mask for emissivity correction.
Notably, areas dominated by high rise residential buildings to not feature as particularly warm areas except there buildings have been placed very close together, as in some of the newer estates such as Bishan and Hougang. Here, shortwave radiation normally lost by reflectance may be subject to multiple reflectances due to a low sky view factor. Where relatively wide spacing has been adhered to, vegetated surfaces between buildings promote evaporative cooling and incoming shortwave radiation is reduced by tree canopies and building shadows. This finding corresponds with the that observations of Roth and Oke on the heat island in the city of Vancouver, that the commercial core of the city, comprising many densely packed tall buildings is not the warmest area. They were surprised to observe that light industrial activities located in buildings large in plan area, exhibited the highest surface temperatures (Rothe and Oke, 1989).
The higher correlation observed between the emissivity corrected mean temperatures and LAI (r = - 0.73), than for uncorrected ( r = 0.24) was expected, firstly in view of the differential heat flux relationships of different land cover types, and secondly due to the increase spatial resolution obtained by ratioing the TM6 data with the 30 metre data of the visible wavebands.
Conclusion
A GIS – based approach to surface temperature mapping permits the visualization of discrete, selected temperature classes against known surface parameters by the combined use of Geographic Definition and Database Attribute files. Additionally, the use of remote sensing pixel data for emissivity correction effectively increases the spatial resolution of the thermal band by rationing with the higher, resolution visible channels used s a vegetation index. This increased resolution is particularly important when identifying micro-scale temperature variations as within housing estates. In study area 2 the high correlation between Surface temperature and biomass was surprising in view of the heterogeneity of the land cover classes in relation to the original 120 metre resolution of the sensor, and could only have been achieved using higher resolution temperature data, realistically corrected for emissivity.
Surface Temperatures observed in the present study appear to be site specific such that steep temperature gradients are found across land cover boundaries. Meso-scale patterns associated with the dominant trends of air movement across the island are not evident. The low wind speeds in Singapore generally, (mean wind sped is approximately 2m. sec) suggest a close relationship between surface and air temperature, emphasising the need for the evaporative cooling effect of vegetation canopies. Assuming this close correlation between surface and air temperatures (which requires further investigation), satellite derived surface temperatures can be used to indicate trends in ambient air temperature in relation to future land use change, pin-pointing potential ‘hotspots’ in the living environment.
| 1. | 2. | 3. | 4. | 5. | 6. | |
| ESTATE | BODY TEMP0C | SURF.TEMP0C | AREA(HA) | BUILT(%) | LAI | TM2RAD.* |
| ANG MO KIO | 22.22 | 26.27 | 520 | 59 | 16 | 4.6 |
| BISHAN | 22.39 | 28.96 | 128 | 41 | 2 | 5.2 |
| HOUGANG | 22.33 | 29.12 | 470 | 59 | 2.4 | 5.1 |
| POTONGPASIR | 22.21 | 27.16 | 46 | 43 | 7.3 | 4.9 |
| SERANGOON C | 22.15 | 28.52 | 128 | 51 | 2 | 5.0 |
| SERANGOON N | 22.24 | 29.32 | 54 | 52 | 2.8 | 5.2 |
| SHUNFU | 22.24 | 27.65 | 14 | 46 | 4.3 | 4.8 |
| TEMPLE | 22.40 | 26.39 | 28 | 37 | 0.5 | 4.5 |
| TOA PAYOH | 22.28 | 25.83 | 298 | 63 | 14.3 | 4.4 |
Notes
1. TM2 was used as the vegetation index since a closer relationship between this and LAI was observed than for the Normalised Difference Vegetation Index, (NDVI).
2. The value of 0.89 for non-vegetated and 0.97 for vegetated areas were derived from ground measurements of Surface Temperature and radiance.
Rerences
BALLING, R.C. and S.W. BRAZELL 1988 : High resolution surface temperature patterns in a complex urban terrain. Photogrammetric Engineering and Remote Sensing 54,9 1289-1293.
CURRAN, P. 1985 : Principles of Remote Sensing , Longman.
GIBBONS, D.E. and G.E. WUKELIC 1989 : Application of LANDSAT Thermatic Mapper data for coastal thermal plume analysis at Diablo Canyon. Photogrammetric Engineering and R. Sensing 55 6 903-909.
MORGAN, D., L. MYRUP, D. ROGERS and R. BASKETT 1977 : Microclimate within an urban area. Annals Ass. Amer. Geog. 55-65.
ROTH, M. and T.R. OKE 1989 : Satellite derived urban heat islands from three coastal cities and the utilization of such data in urban climatology. Int. Journal or Remote Sensing 10 11 1699-1720.