| GISdevelopment.net ---> AARS ---> ACRS 1991 ---> Education/Research |
Reflective of Land and
Water
Y.J. Chong and T.L.
Tan
Department of Physics
National University of Singapore
Republic of Singapore 0511
Department of Physics
National University of Singapore
Republic of Singapore 0511
Abstract
In Remote Sensing using visible and near infra-red radiation information concerning the earth is primarily derived from an analysis of the reflectivities of land and water surfaces. To elucidate the wavelength dependence of Lambertian reflection by surfaces, a computer program has been developed to process digital microcomputer. The programs have been developed using a high level language, Turbo Basic, which is an integrated system of compiler, interactive editor and trace debugging software. Using an enhanced graphics adaptor (EGA) display card, the satellite image can be displayed on a multisync monitor with a resolution of 640 by 350 pixels in 16 pseudo colors.
1. Introduction
The growth in the applications of satellite Remote Sensing to the study of the earth will lead to an increasing use of data acquired from space-borne sensors. There is need to enhance the proper understanding of the scientific methodology of Remote Sensing among the potential users of the technology.
Quantities observable from space should be clearly identified and a system of description of surface phenomena in terms of Remote Sensing parameters should be developed.
In Remote Sensing using visible and near infra-red radiation information concerning the earth surface is primarily derived from an analysis of the Lambertian reflectivities of land and water surfaces.
An in depth understanding of the dependence of the reflectivity of a surface on the wavelength of the electromagnetic radiation involved would greatly facilitate the user in the correct interpretation of Remote Sensing data as well as in the development of methodologies that are appropriate for a specific type of Remote Sensing application.
Computer Hardware and Software
The most effective way to arrive at an accurate understanding of the nature of Remote Sensing data is to process the digital data with a computer. However, in many instances, the fear of incurring a heavy investment in computer hardware and software in the processing of Remote Sensing data often prevents many potential users from embarking on such a venture.
In this study use is made of a very common, easily available, general purpose AT-compatible microcomputer. No special computer hardware need be acquired for the study of Remote Sensing data.
The programming language use is also a commonly available, multi-purpose integrated system of compiler, interactive editor and trace debugging software, called Turbo Basic.
A user-friendly interactive program has been developed allowing the user the freedom to choose and vary several parameters in the processing and display of the images.
The satellite images are displayed on the monitor of the microcomputer. Using an enhanced graphics adaptor (EGS) display card, the image can be displayed on a multiusync monitor with a resolution of 640 by 350 pixels in 16 pseudo colors.
The program would enable the user to choose the most appropriate form of density slicing and the color to represent each slice. The user can be also select colors to represent individual values of the radiance digital number.
Remote Sensing Data
The program is capable of handling any type of passive satellite Remote Sensing data in the form of 8- bit bytes. The data that have been used include those from Landsat, SPOT and MOS, and NOAA satellites. In the case of the NOAA AVHRR, the data is first truncated from 10-bit to 8-bit.
The Remote Sensing data may be stored on standard diskettes and read by standard floppy disk drives. By linking the microcomputer to a main frame computer, data from a computer compatible tape can also be downloaded into the hard disk of the microcomputer.
Examples of Satellite Images
In the examples show here, the data used were those acquired by the SPOT-1 HRV Multispectral sensor on 19 June 1986. The data is in three bands namely:
Band 1 0.50 to 0.59 micrometers
Band 2 0.61 to 0.68 micrometers
Band 3 0.79 to 0.89 micrometers
The area shown in Pulau Tekong and its vicinity. In this subscene of 640 by 350 pixels with a spatial resolution of 20 meters there is a wide variety of land and sea surfaces. On the land there are secondary forests, mangrove swamps, plantations, open fields, man-made cultural features, and land newly reclaimed from the sea. There is also a fresh water reservoir. On the sea the carrying bathymetric depths are indicated by the nature and concentration of sediments resulting in different reflectiveties in the various bands.
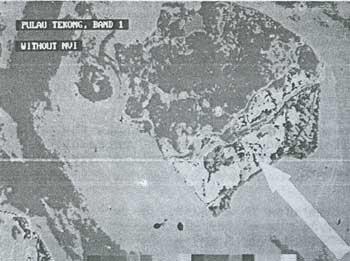
Figure 1 Image of Pulau Tekong in Band 1
(The band width is 0.50 to 0.59 micrometres)
The land newly reclaimed from the sea stand out sharply in contrast to other features on land and in the sea. This is because the reflectivities of the reclaimed land in the 0.50 to 0.59 micrometer region of the electromagnetic spectrum are distinctly higher than those of other surfaces.
Because of its turbidity the reflectivities of the sea water are not very different from those of land with vegetation cover.
The reflectivity of the clean fresh water in the reservoir is quite different from the reflectivities of sea water.
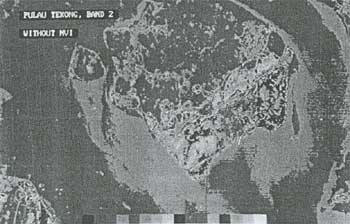
Figure 2 Image of Pulau Tekong in Band 2
(The band width is 0.61 to 0.68 micrometres)
Just as in the case of band 1, the land newly reclaimed from the sea stand out sharply in contrast to other features on land and in the sea. This is because the reflectivities of the reclaimed land in the 0.61 to 0l68 micrometer region of the electromagnetic spectrum are also distinctly higher than those of other surfaces.
There is less variation in the reflectivities of the sea water. In the near infra-red region, land is clearly delineated from water.

Figure 3 Image of Pulau Tekong in Band 3
(The band width is 0.79 to 0.89 micrometres)
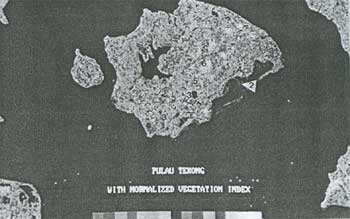
Figure 4 Image of Pulau Tekong in NVI
The normalized vegetation index, NVI, is computed from bands 3 and 2 as follows :
NVI = (Band 3 - Band 2 ) / (Band 3 + Band 2)
The newly reclaimed land which has very little vegetation cover appears distinctly different form the rest of the land with vegetation cover.
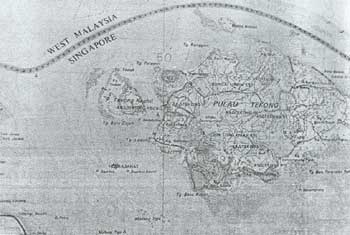
Figure 5 Topographic Map of Pulau Tekong