| GISdevelopment.net ---> AARS ---> ACRS 1991 ---> Education/Research |
Case studies for landcover
chance analysis using Micro-Asean
Abd-alla Gad A.
G.
National Research Center &
Remote Sensing Center,Cairo, Egypt
hoji Takeuchi,Kauhei Cho,Mitsunori Yoshiura
Remote Sensing Technology
Center of Japan, Tokyo 106, Japan
National Research Center &
Remote Sensing Center,Cairo, Egypt
hoji Takeuchi,Kauhei Cho,Mitsunori Yoshiura
Remote Sensing Technology
Center of Japan, Tokyo 106, Japan
Abstract
MICRO – ASEAN, the image analysis software for a personal computer developed through the join research project between ASEAN countries and Japan, has now become available for various studies for monitoring of landcover change using remote sensing. Because of its high cost performance and easy-handling, MICRO-ASEAN has been used as one of the core systems for the training courses for remote sensing data analysis. This paper reports some results obtained from the case studies conducted using MICRO-ASEAN at the training course as well as at the joint research. Two kinds of case studies are reported, one is the analysis using MOS-1/MESSR and Landat/MSS for landcover change at Tama Area, one of new urbanized areas in Tokya Capital Region, which was conducted as the subject for the remote sensing training course. The other is the case study for monitoring of the wide-range landcover condition is Thailand using NOAA/AVHRR data combined with MOS-1/MESSR data. Through these case studies, MICRO-ASEAN was proved to be used effectively and practically for landcover monitoring by remote sensing.
Introduction
Since a personal computer technology has made a remarkable progress, the image analysis software using a personal computer for practical use of remote sensing data has become possible to be realized. MICRO-ASEAN (MICRO computer-based Advanced System for Environmental Analysis with remote sensing data) was developed on the above background through the joint research project with ASEAN countries by Special Coordination Funds of the Science and Technology Agency of Japan. This software was developed based on the software package called MICRO-TIPE developed by Tokai University and extended to the system including the functions for GIS and the analysis of multi-temporal and multi-stage remote sensing data.
MICRO-ASEAN has now become one of the important systems used for the international cooperation for promoting remote sensing data utilization in developing countries, such as the training course for remote sensing technology. This paper reports some examples of the case study using MICRO-ASEAN, which will be very useful as the subject for remote sensing data analysis at the training courses as a typical study for monitoring of landcover change. Two kinds of case studies are reported, one is the analysis using MOS-1/MESSR and Landsat/MSS at Tama Area, one of new urbanized areas in Tokyo Capital Region, which was conducted as the subject at the training course held by JICA (Japan International Cooperation Agency). The other is the case study for monitoring of wide-range landcover condition in Thailand using NOAA/AVHRR data combined with MOS-1/MESSR data, which was conducted as a part of the joint research described above.
Landcover Change Extraction of Tama Area Using MESSR and MSS Temporal Images
- Background and Location of Study Area
The increase of the population in Tokyo Capital Region has urged the society to extend its residential area. This trend has an impact on the environment. The purpose of this study is to test the applicability of MICRO-ASEAN system for detecting the change of landcover through a particular case. Two satellite images for the study area were used; MOS-1/MESSR data Nov. 1990 and Landsat/MSS dated Oct. 1981. The test site “Tama Area” is located 30-40 km from the center of Tokyo on the Tama Hill to the west. A new planned city “Tama New Town” has been developed in this area. The total area of the New Town is about 3,016 hectares. Development of Urban facilities such as roads, water works, etc. is carried out for a planned population of 370,000 people, while housing constructing is planned for an expected residential population of 310,000.
- Methods
The data analysis flow is shown in Fig. 1. Two approaches were applied to investigate both of landcover condition and landcover change. The first approach as landcover classification procedures by supervised maximum likelihood classification method. The second one was the change detection using normalized vegetation index (NVI).
In the second approach, a normalization procedure was applied for both of MESSR and MSS images to follow the change in NVI. Then, the discrimination of vegetated and non-vegetated land was performed for both temporal images. Landcover change between vegetation and non-vegetation was extracted using the result of discrimination by NVI.
- Results and Discussions
The system allowed to select 14 landcover categories including total 30 training areas. It was possible to confirm a particular spectral signature of each object. The result of confusion matrix of the training data set showed a significant correlation in classification of the following categories; Factories (85.8%), Forest 1 (84.8%), forest 2(92.3%), Bare soil (93.9%), Water (97.6%), City 4(81.%), City 1(88.5%) and Graves (84.9%). However, weak coincidence were found in other different categories (e.g. Golf Courses and Secondary Forest). This can be attributed to the mixing of these categories in feature space and also to the seasonal effect of vegetation cover.
Fig. 3. shows the result of change detection using NVI. This image was obtained though the filtering of resultant image by change detection procedures between vegetation and non-vegetation. Table 2. shows the result of area measurement of three kinds of changing patterns, 0;no change, 1;change from vegetation. The result shows a significant change from vegetation to vegetation. The result shows a significant change from vegetation to non-vegetation (type-1). By comparing Fig. 2 with Fig.3, the changed area of type-1 almost corresponds to the surrounding urban areas of Secondary Forest. This suggests that significant change from the secondary forest to urban occurred during 9 years difference between the observation dates of MESSR and MSS images.
The NVI index used in this case study is considered to be a satisfactory indication of vegetation coverage and to be used effectively in detecting the change in landcover by using multi-temporal images. Also this method seems to give more reliable result for the change detection than the method by performing the landcover classification of dual images using maximum likelihood method (MLM), because the landcover classification procedure is more simple for the method using NVI than that by MLM.
Fig. 1 Data analysis flow for landcover change investigation in Tama Area
Table 1 Result of area measurement of landcover classes in Tama Area
| Code | Landcover Class | Area (km) | Occupation Rate (%) | Code | Landcover Class | Area (km2) | Occupation Rate (%) |
| 1. | Factory | 25.9 | 5.06 | 8 | Secondary Forest | 52.4 | 10.23 |
| 2. | Agricultural F. | 69.5 | 1357 | 9 | Water | 1.6 | 0.31 |
| 3. | Rice Field | 48.6 | 9.50 | 10 | City4 | 79.5 | 15.53 |
| 4. | Forest1 | 13.5 | 2.63 | 11 | City1 | 34.2 | 6.69 |
| 5. | Forest2 | 17.3 | 3.38 | 12 | City2 | 15.1 | 2.94 |
| 6. | Bare Soil | 12.1 | 2.36 | 13 | Graveyards | 4.4 | 0.85 |
| 7. | Golf C. (Grass) | 37.3 | 7.28 | 14 | City3 | 100.5 | 19.63 |
Table 2 Result of area measurement of change patterns between vegetation and non-vegetation.
| Code | Change Pattern | Area in Km2 | Occupation Rate (%) |
| 0 | No change (both of Vegetation and Non-veg.) | 462.1 | 90.26 |
| 1. | Change from Vegetation to Non-vegetation | 39.1 | 7.63 |
| 2. | Change from Non-vegetation to Vegetation | 10.8 | 2.11 |
 Fig 2. Landcover classification image of Tama Area |
 Fig 3. Result of change detection of Tama Area |
Landcover Change Extraction in the Central Plain of Thailand Using NOAA/AVHRR Combined with MOS-1/MESSR.
- Background and Objective
The analysis of multi-temporal images described in 2.1 is considered to be the basic approach to monitor the landcover condition by remote sensing. However, t is very difficult to monitor the wide-range are using only Landsat or MOS-1/MESSR images because of their, which covers narrow coverage. On the other hand, NOAA/AVHRR image, which covers over 2,000 km swath, is considered to be the most suitable data for wide-range monitoring. In this case study, the analysis of NOAA/AVHRR image combined with MOS-1/MESSR image was tried to monitor the landcover change of the whole area of the central plain of Thailand. The combined use of the sensors which have different resolution each other is expected to enable the quantitative analysis on the special landcover type such as vegetation converge in wide-range areas.
- Methods
The data analysis flow is shown in Fig. 4. The important point of this approach is to obtain the relation between the spectra of AVHRR data and the occupation rate of a special landcover type within a pixel size of AVHRR through the regression analysis of AVHRR and MESSR data. The occupation rate of the landcover can be easily compted from the result of the classification of the landcover type from MESSR image. The test site where MESSR data are superimposed onto AVHRR is limited in a narrow area, however, the relation obtained from the test site can be extended to the area of AVHRR coverage and the quantitative information on the distribution of the landcover type can be estimated in wide-range areas.
- Results and Discussions
The test site for AVHRR-MESSR superimposition was selected in the north-east area from Bangkok of the Central Plain. Three types of landcover, vegetation, dry bar soil and wet bare soil, were extracted from two temporal MESSR images (taken on Dec. 7, 1989 and on Jan. 11, 1990). The extraction of these landcover types were performed using the normalized vegetation index (NVI) for vegetation and the brightness feature (BRT) for dry and wet bare soil. The latter feature was obtained by the summation of all band data of MESSR. Table 3 shows the result of the regression analysis using the percent occupation of the three landcover classes obtained from MESSR the spectral features of AVHRR data. Three types of spectral features were used for AVHRR, NVI, BRT (summation of the first and second bands of AVHRR) and CH4 (the fourth band of AVHRR, the thermal land). In Table 3, a significant high correlation is found between vegetation occupation rate and NVI feature of AVHRR. For the occupation rate of dry bare soil, the multiple regression using NVI and CH4 of AVHRR gives relatively high correlation. For wet bare soil, the result is not satisfactory, which is considered to be due to small occupation of wet bare soil in the test site.
Fig. 4. Data analysis flow for wide-rage monitoring using NOAA/AVHRR combined with MOS-1/MESSR.
Table 3 Result of regression analysis between AVHRR spectral features and occupation rate of primary landcover classes.
| Target Variables | Data | Observation Variables amp; Correlation Coefficient | |
| Percent Occupation of Landcover Class | Single Regression | Multiple Regression | |
| NVI BRT CII4 | NVI+CII4 BRT+CH4 VI+BRT+CII4 | ||
| 1. Vegetation | 89/12 90/01 |
0.845 0.625 0.918 0.837 |
0.845 0.846 0.921 0.930 |
| 2. Dry Bare Soil | 89/12 90/01 |
0.699 0.481 0.343 0.558 |
0.822 0.825 0.731 0.774 |
| 3. Wet Bare Soil | 89/12 90/01 |
0.627 0.038 0.399 0.020 |
0.632 0.646 0.404 0.429 |
Conclusions
Through two case studies described above, MICRO-ASEAN was proved to be used effectively to investigate the landcover change as well as the present landcover conditions. For the investigation in a small local area exemplified in the first case study, the image analysis using multi-temporal images such as Landsat/MSS or TM and MOS-1/MESSR seems to be satisfactory to achieve the extraction of landcover change. Also the method for change detection in the first case study seems to be able to become a standard procedure for the practice of the detection of landcover change because of its simplicity and easiness for landcover classification procedure.
The second case study is aimed to establish the procedure for achieving the monitoring of the Wide-range landcover change. Especially, the combination of different type of sensors is considered to be an very effective method for the practical applications and to be the important trend as the monitoring techniques using remote sensing data.
MICRO-ASEAN seems to be able to be used successfully from now on as the standard system for the international cooperation through the practice for the case studies on landcover monitoring described in this paper.
Finally, the second case study described in this paper was conducted through special Coordination Funds of the Science and Technology Agency of Japan in fiscal 1990.
References
- Takeuchi S., K. Cho, M. Yoshimura et al, 1991 ; Development of Image Analysis Using Multi Data Source for Monitoring of Tropical Area, Technical Report of Joint Research on the Enhancement and Application of the Remote Sensing Technology with ASEAN Countries Prepared for the Symposium on Join Research project on the Enhancement and Application of the Remote Sensing Technology between ASEAN Countries and Japan, Feb. 5-7, 1991, Bangkok, Thailand.
- Fukue K., H. Shimoda, and T. Sakata, 1986; Development of A Personal Computer Based Image Processing System, The 7th Asian Conference on Remote Sensing, Seoul, Korea.
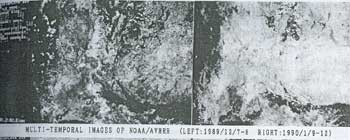
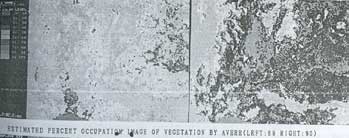
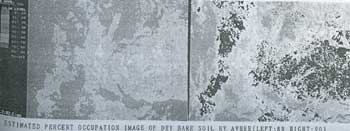
Fig. 5. Result of the estimation of the occupation rate or primary landcover classes using the result of regression in Table 3 and NOAA/AVHRR images in the Central Plain of Thailand.