| GISdevelopment.net ---> AARS ---> ACRS 1991 ---> Agriculture/Vegetation |
Spectral Reflectivity of the
Crop leaves damaged by Cnaphalocrocis medinalis and Spodoptera litura
Haruhiko Tahahoto,
Kazushinge Sogawa, Tomonari Watanabe and Hiroya Higuchi
Kyusyu National Agricultural Experiment Station
Nishigoshi, Kumamoto 861-11, Japan
Kyusyu National Agricultural Experiment Station
Nishigoshi, Kumamoto 861-11, Japan
Abstract
The most effect spectral reflection parameter for estimating the percentage of rice leaf areas eaten by Cnaphalocrocis medinalis was (R750nm -R450nm)/(R750nm + R450nm).
The regression equation was the percentage of damaged leaf areas = 144.5 = 180.5 { (R750nm -R450nm)/(R750nm + R450nm)}. The correlation coefficient was -0.971.
The most effect spectral reflection parameter for estimating the percentage of soyabean leaf areas eastern by spodoptera litura was (R750nm -R600nm)/(R750nm + R600nm). The regression equation was the percentage of damaged leaf areas = 119.0 - 166.0 {(R750nm -R600nm)/(R750nm + R600nm)}. The correlation coefficient was -0.983.
The observed and estimated percentages of damaged leaf areas were distributed on the ration line one to one. The correlation coefficient for the rice and soyabean leaves infested with C.medinalis and S.litura were 0.981 and 0.966, respectively.
Introduction
The larvae of Cnaphalocrocis medinalis GUENEE and Spodeptera litura FABRICIUS are important leaf eaters of rice and soyabean respecvely in western parts of Japan.
Non-destructive method for estimating the percentage of damaged leaf areas of rice and soyabean single leaves infested with these insect pests were investigated using spectroradionmeter.
Materials and methods
Rice and soyabean were planted in the experimental fields of Kyusyu National Agricultural Experiment Station (Chikugo, Fukuoka Prefecture) in 1990. Rice cultivar used was "Saikai 184" (India rice variety), which was sown on May 16th, and transplanted in a paddy field of June 18th 1990. Three seedlings per hill were transplanted at a spacing of 25*21cm (19.0 plants/m2). A total amount of 120kg/ha of nitrogen and applied as ground fertilizer. Soyabean cultivar used was "Fukuyutaka", which was sown on July 10th. Three seeds per hills were sown as s spacing of 65*20cm. (7.7 plants m2). A total amount of 30kg of nitrogen was applied as ground fertilizer.
Rice and soyabean leaves damaged by C. medinalis and S.litura respectively were sampled in late September, which show characteristic whitish sears. Damaged and intact leaves whose chlotophyll contents are nearly identical were selected by green meter (MINOLTA, SPAD-502) for the analysis of spectral reflectance. Spectral reflectivity were measured by spectrometer (LICOR, LI-1800/22) equipped with integrating sphere (LICOR, LI-1800-12). The spectrometer and integrating sphere were linked with a fiber optic probe. Spectral reflectivity of leaf surface was measured holding sample holder (diameter :12mm) of integrating sphere (fig. 1).
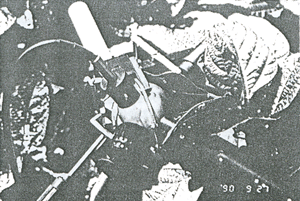
Figure 1. Measurement of spectral reflectivity using spectroradiometer
Sample reflectance (Rs) was calculated from Rs = (Rs - Fd) / (Fr - Fd)
where Fs is the radiant flux measured in reflectance mode with the sample in the sample port of the integrating sphere, Fd is the radiant flux measured with no sample in the sample port, Fr is the radiant flux measured in reflectance mode a pressed barium sulphate (BaSO4) calibration reference in the reference port. Fs, Fd and Fr were measured for each sample, and Rs was calculated. Sample reflectance was determined in 6nm bands placed at 5nm wavelength intervals from 400nm to 1100nm.
Leaf samples damaged at various degrees were submitted for the measurement of spectral reflectivity. After recording of reflectivity, damaged leaf areas in sample holder were measured with an automatic area meter (AAM-7, Hayashi - Denko). The percentage of damaged leaf areas were calculated from
The percentage of damaged leaf area (%) = damaged leaf areas (cm2)/leaf areas (cm2)
Measurements were made for 32 samples of rice leaves, 33 samples of soyabean leaves.
The analysis was used 7 visible (400nm, 450nm, 500nm, 550nm, 600nm, 650nm, 700nm) asn 8 near infrared wavelength (750nm, 800nm, 850nm, 900nm, 950nm, 1000nm, 1050n, 1100nm). The effective spectral reflection parameters for estimating the percentage of rice and soyabean leaf area eaten by C. medinalls and S. litura were used reflectivity (Rxnm2), difference (Rxnm - Rynm), that ratio between reflectivities at any 2 wavelengths (Rxnm - Rynm), that ratio between difference and sum of those reflectivties (Rxnm - Rynm)/ (Rxnm + Rynm).
Results and Discussions
1. Spectral reflectivity characteristics of damaged leaf by C.medinalis and S.litura.
The external symptoms of rice and soyabean leaves infested with C. medinalis and S. litura, respectively, were characteristic of their conspicuous whitish sears (fig. 2). Spectral reflectivity characteristics of damaged leaf (the percentage of damaged leaf areas: 0%-65.2% by C.medinalis were showed Fig. 3. Spectral reflectivity of intact leaf (percentage of damaged leaf areas : 0%) was lower from 400nm to 700nm in visible range, spectral reflectivity was higher from 750nm to 1100nm in near infrared range. Reflectivity was higher in visible range, and lower in near infrared range as percentages of damaged areas increase. Spectral reflectivity of damaged leaf (the percentage of damaged leaf areas : 65.2%) was about 21% from 550nm to 700nm, spectral reflectivity in near infrared range was 40%. The percentage of damaged leaf areas (62.5%) was lower (about 12%) than spectral reflectivity of intest leaf.
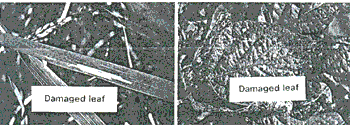
Figure 2. Rice leaves damaged by Cnaphalocorocis medinalis (left) and soybean leaves damaged by Spodoptera litura (right).
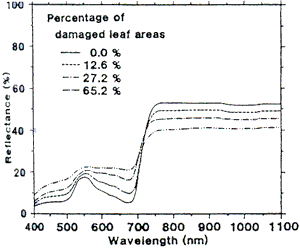
Figure 3. Spectral reflectance of rice leaves damaged by Cnaphalocrocis medinalis
Spectral reflectivity characteristics of damaged leaf (the percentage of damaged leaf areas : 0% - 87.6%) by S. Litura were showed Fig. 4 spectral reflectivity of intest leaf (percentage of damaged leaf areas :0%) was lower in visible range, spectral reflectivity was higher in visible range as same as rice. Spectral reflectivity of percentage of damaged leaf areas (87.6%) was 23% in near infrared range and the percentage of damaged leaf areas (87.6%) was lower (about 55%) than spectral reflectivity of intest leaf.
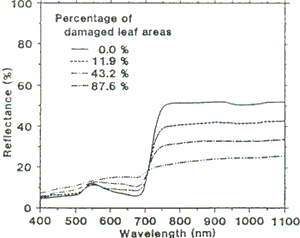
Figure 4. Spectral reflectance of soybean leaves damaged by Spodoptera litura
2. The most effective spectral reflection parameter for estimating the percentage of rice leaf area eaten by C. medinalis.
The relationship between reflectivity at each wavelength from 400nm to 1100nm with 50nm intervals and the percentage of damaged leaf areas by C. medinalis were investigated. The correlation coefficient of R400nm (the spectral reflectivity at 400nm), R450nm, R500nm and R650nm were 0.949, 0.966 0.963 and 0.942 respectively.
Difference and the ratio between reflectivities at any 2 wavelength, and the ratio between difference and sum of those reflectivities were calculated. Among then, the ratio between the difference and sum of the following 2 wavelength {(R750nm -R450nm) / (R750nm + R450nm), (R750nm -R500nm) / (R750nm + R500nm), (R800nm -R500nm) / (R800nm + R500nm)} gave higher the correlation coefficient with percentage leaf areas, -0.971, -0.970, -0.969, -0.968, respectively. The most effective spectral reflection parameter for estimating the percentage of rice leaf area eaten by C. medinalis was (R750nm -R450nm) / (R750nm + R450nm (Fig. 5)
The percentage of damaged leaf area (%) = 144.5 - 180.5 {{(R750nm -R450nm) / (R750nm + R450nm) (1) (r = -0.971, n = 32, sep = 5.79)
R750nm and R450nm were the spectral reflectivities at 750nm and 450nm, respectively. Sep was standard error of paediction.
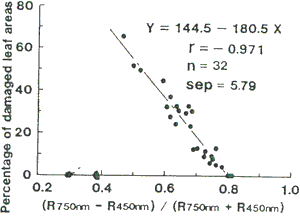
Figure 5 Relationships between reflectivity ratio (R750nm-R450nm)/(R750nm+R450nm) and the percentage of damaged leaf areas of rice leaves infested with Cnaphalocrocis medinalis. R750nm and R450nm were the spectral ref;ectivities at 750nm and 450nm, respectively
3. The most effective spectral reflection parameter for estimating the percentage of soyabean leaf area eaten by S.litura.
The relationship between reflectivity at each wavelength from 400nm to 1100nm with 50nm intervals and the percentage of damaged leaf areas by S. litura were investigated. The correlation coefficient of R650nm, R750nm, R800nm and R900nm were 0.930, -0.947, -0.943, -0.936 and -0.932, respectively.
Difference and the ratio between reflectivities at any 2 wavelength, and the ratio between difference and sum of those reflectivities were calculated. Among then, the ratio between the difference and sum of the following 2 wavelength {(R750nm -R600nm) / (R750nm + R600nm), {(R750nm -R650nm) / (R750nm + R650nm), {(R80nm -R600nm) / (R800nm + R600nm) and {(R800nm -R650nm) / (R800nm + R650nm)} gave higher the correlation coefficient with the percentage damaged leaf areas, -0.983, -0.982, -0.981 and -0.981 respectively. The most effective spectral reflection parameter for estimating the percentage of rice leaf area eaten by C. medinalis was ({(R750nm -R600nm) / (R750nm + R600nm) (fig. 6).
The percentage of damaged leaf areas (%) = 119.0 - 166.0 {(R750nm -R600nm) / (R750nm + R600nm)}
R750nm and R600nm were the spectral reflectivities at 750nm and 600nm, respectively.
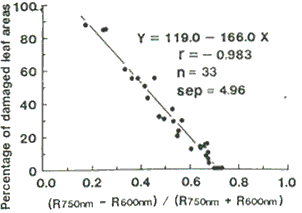
Figure 6. Relationships between reflectivity ratio (R750nm-R600nm)/(R750nm+R600nm) and the percentage of damaged leaf areas of soybean leaves infested with Spodoptera litura. R750nm and R600nm were the spectral reflectivities at 750nm and 600nm, respectively.
4. Validity regression equation for the estimating percentage of leaf areas damaged by C. medinalis and S. Litura.
Relationships between observed and estimated percentage of damaged leaf areas of rice and soyabean leaves infested with C. medinalis and S.litura were Fig. 7.
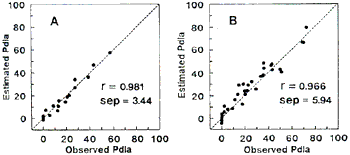
Figure 7. Relationships between observed and estimated the percentage of damaged leaf areas (Pdla) of rice and soybean leaves infested Cnaphalocrocis medinalis (A) and Spodoptera litura (B), respectively.
The observed and the estimated values were distributed on the ration line one to one. The correlation coefficient for the rice sand soyabean leaves infested with C.medinalis and S.litura were 0.981 and 0.966, and then standard error of prediction were 3.44 and 5.94 respectively.
The above results suggested that the percentage of damaged leaf areas of rice and soyabean single leaves infested respectively with C.medinalis and S.litura, could be estimated quantitatively by non-destructive measuring method using spectroradiometer.
Acknowledgements
The authors would like to acknowledge the continuing guidance and encouragement of Prof. Dr. Yoshinori Suzuki, the Yamaguchi University. We are indebted to laboratory of Crop Eco-Physiology and laboratory of Resource Evaluation for providing field and spectroradiometer for us.
Reference
- Ahern, F.J., 1988 : The effects of bark bettle stress on the foliar spectral reflectance of lodgepole line. Int. J. Remote Sensing, 9, 1451-1468.
- Aoki, M. M.Xim, K. Yabuki, and T. Totsuka, 1986 : Remote Sensing of Chlorophyll content of leaf (2). Effective spectral reflective characteristics for evaluations of plant community. Environ. Control in Biol, 24, 33-39. (in Japanese with English summuy)
- Leckie, D.G. D.P. Ostaff, P.M. Teillet and G. Fedosjevs, 1989: Spectral characteristics of Tree Components of Balsam Fir and Spruce Damaged by Spruce Budworm. Forest Science, 35, 582-600.
- Kanemasu, E.T., 1974: Seasonal Canopy reflectance patterns of wheat, sorgum an soyabean. Remote Sensing of Environment, 3, 43-47.
- Miyashita.T. 1985: Estimation of Economic Injury Level in Rice Leaf Roller, Cnaphalocrocis medinalis Guenee (lepidoptera : Pyralidae).
- Relation between yield loss and injury of rice leaves at Heading or in the grain filling period. Jpn. J. Appl. Ent. Zool. 29, 73-76. (in Japanese with English Summuy)
- Saito T, H. Kawamoto and K. Kiritani, 1983: Effect of Artificial Defoliation on Groeth aon Yield of Soyabean : Development of Dynamic Economic Injury Level and control Threshold. Jpn. J. Appl. Ent. Zool. 27, 203-210 (in Japanese with English summuy)
- Shibayama, M and K. Munakata, 1986: A Spectroradiometer for Field Use 3. A comparison of some vegetation indices for predicting luxuriant paddy rice biomass. Japan Jour. Crop Sci., 55, 47-52.
- Shibayama, M. and T. Akiyama, 1986: A spectrometer for field use 6. Radimetric estimation for chlorophyll index of rice canopy. Japan Jour. Crop. Sci. 55, 433-438.
- Yamamoto H. and H. Honjo, 1990 : Evaluations of leaf Areas Index and Biomass of Soyabean Canopies using spectral Reflectivity. J. Agr. Met., 46, 19-22 (in Japanese with English summuy)