| GISdevelopment.net ---> AARS ---> ACRS 1991 ---> Agriculture/Soil |
The Affection of the
Vegetation Change on the Eroded Soil in South-East Asia
Takeharu Kawai, Shunji
Murai
Institute of Industrial Science The University of Tokyo
7-22-1, Roppongi, Minato-ku, Tokyo 106 Japan
Shiro Ochi
United Nations Centre for Regional Development (UNCRD)
1-47-1, Nagono, Nakamura-ku, Nagoya 450 Japan
Institute of Industrial Science The University of Tokyo
7-22-1, Roppongi, Minato-ku, Tokyo 106 Japan
Shiro Ochi
United Nations Centre for Regional Development (UNCRD)
1-47-1, Nagono, Nakamura-ku, Nagoya 450 Japan
Abstract
Worldwide decrease of forest causes of disaster such as flooding due to the reduction of water retention, desertification, and soil erosion etc. Especially in South-East Asia, soil erosion due to deforestation has become a serious problem in this decade.
In this paper, the relationship between water runoff, vegetation, and soil erosion is studies. The quantity of eroded soil at the test area is estimated from the Digital Elevation Model (DEM) and present vegetation which is calculated from the SPOT imagery. The final objective is to examine the affection of the vegetation change on the water runoff and the change of the quantity or eroded soil.
Introduction
Soil erosion, which influences not only the agriculture but also on the environment, has become a very serious problem at many places in the world. It is important to assess the impact on soil due to the vegetation change, which means the large-scale deforestation in many cases so far as South-East Asia in concerned, because it is one of the reasons why erosion happens.
The objective of this study are :
- to propose a new soil erosion model with use of Remote Sensing data, and
- to examine the relationship between the vegetation change and the extent of soil erosion using the proposed model.
The existing models on soil erosion are divided into two categories from the point of the scale.
- the “Micro-scale” type
- the “Macro-scale” type
Proposal of the Soil and Water Flow Model
3.1 Overview of the model
The objectives of the proposed model are as follows :
- to utilize Remote Sensing data effectively, and
- to present the relationship between vegetation change and soil erosion
Vegetation influences soil erosion mainly in two ways. One is water retention effect at the roots of plants, which influences rill and gully erosion it is taken into consideration in the model to meet the second objective. The other is natural canopy effect that leaves and branches interfere with rain’s strike on the ground, which influences splash and sheet erosion. However, the amount of eroded soil because of splash and sheet erosion is usually relatively small. Therefore a substitutive method may be applicable, for example to incorporate a certain portion of rainfall into inflow volume previously and regard the rest as “appropriate” rainfall.
3.2 The Submodel for Water Flow
The outline of the submodel for water is shown in Figure 1. This figure describes the movement of water and soil at one grid and one step. “Standard” total outflow means the outflow volume presumed for a certain “standard” inclination when the flowing destination after this step has not been determined yet. The bold solid arrows mean the flow of water.
As described above, the flowing direction will be selected from eight neighboring grids. If the selected grid which is of course the lowest of eight ones, is still higher than the central grid, it is assumed that water is accumulated on the surface of the central grid until its volume excesses the product of the grid area and height difference.
3.3 The Submodel for Soil Flow
The outline of the submodel for soil flow is also shown in Figure 1. The flow of soil is described as the bold broken arrows. A remarkable thing is that the quantity of soil outflow is mainly determined by the water outflow. Therefore, the submodel is dependent upon the water submodel.
Figure 1 The Outline of the Proposed Model
3.4 The Whole Model
The whole model is constructed by means of the two submodels adapted to each grid and for computer simulated steps successively.
The mark of ? on figure 1 means the need of empiric equations. It will be useful for their assessment to combine experimental data, existing statistic data, digital elevation model (DEM), and Remote Sensing data.
Application
The proposed model is examined at the test area where a large slope failure happened in the Southern Thailand in 1988. Three alternatives related to vegetation are prepared for comparison.
- when existing forest remains all over the area.
- when existing forest remains at the regions which are higher than a certain height (900m in this case) but the others are deforested.
- When all of the area are deforested.
Where,
FR :the rate of water which flows as the outflow within the inflow water (when the soil has not been saturated yet).
NVI : Normalised vegetation index
For SPOT
BAND3 – BAND 1
BAND3 + BAND 1
FR at the deforested region is defined as 1.
The second one is concerned with the relationship between the outflow of water and that of soil X units of water will flow with X2 units of soil. This is experimentally right when X is not so much.
The third one is concerned with the relationship between outflow and inclination. The amount of the soil outflow will be in proportion to sin2q (q is the gradient) when the water outflow is constant. This is also experimentally right.
The DEM of this area is shown in Figure 2. The lowest grid is painted black, and as the grid is higher, it is painted brighter. The solid black lines indicate the contour line of 900m high. Figure 3 is the result of case a). In the same way, Figure 4 and 5 correspond to case b) and c) respectively. These figures show that the brighter a grid is, the more soil is eroded at the grid. Considering figure 4, case b) is just the medium state between case a) and c). It is thought that vegetation influences on the erosion not only at the existing area but also at lower areas, which is not included in Figure 4. This may be because rainfall and water inflow from other grids are looked upon as the same “inflow” while the types of erosion caused by them are different. The relative volume of soil erosion and water outflow from the test area are shown in Table. 1.
Figure 2 Digital Elevation Model (Solid Lines: Contour Lines of 900m High)
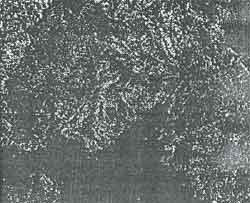
Figure 3 Soil Erosion Map of case a
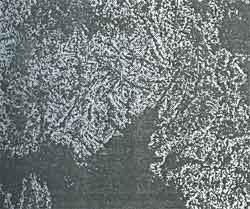
Figure 4 Soil Erosion map Case b
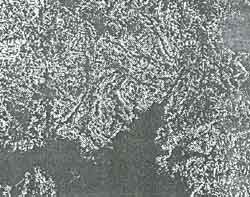
Figure 5 Soil Erosion Map of Case c
Table 1 : The relative Volume of Soil Erosion and Water Outflow from the test area [case a) = 1.0]
Conclusions and Future Prospects
Conclusions are :
- A Macro-scale soil erosion model which can easily utilize Remote Sensing data was proposed.
- Using the model, the change of relative volume of soil erosion and water outflow because of vegetation change was presented.
- The model should be quantitative and accurate. Only relative values (“Unit” is used) and simple equations are used for examination. Therefore, the further study will be made by using the real rainfall data to examine the accuracy of the proposed model.
- The flow velocity is assumed to be constant in this model, which is not practical. It will be corrected in the further study.
- Tatsuro KUSAKA; “A Method of Estimation Soil Loss in Inclined Fields – Characteristics of soil erosion caused by rain water flow (V) –“; Transactions of the Japanese Society of Irrigation, Drainage and Reclamation Engineering, No. 126; December 1986, pp. 41-46 (in English).
- Manu OMAKUPT and Paisal IMPAT; “Soil Erosion Mapping using Remote Sensing and Geographic Information System”. Proceedings of the Tenth Asian Conference on Remote Sensing, November 1989, A-1-3, (In English).
- Shunji MURAI and Shiro OCHI; “a study on Integration of Remote Sensing with Geographic Information system”, Seisan-Kenkyu, Vol. 41, No. 10; August 1989 and October 1989, pp. 37-40 (in Japanese).