| GISdevelopment.net ---> AARS ---> ACRS 1991 ---> Agriculture/Soil |
Remote Sensing with physical
models of soil moisture status to monitor land degradation and drought
Tim R Mc Vicar, David LB
Jupp, Joe Walker
CSIRO Division of Water Resources, Canberra, Australia
Tian Guoliang
Institute of Remote Sensing Application, Chinese Academy of Sciences, Beijing, China
CSIRO Division of Water Resources, Canberra, Australia
Tian Guoliang
Institute of Remote Sensing Application, Chinese Academy of Sciences, Beijing, China
Intoduction
The Murray-Darling Basin (MDB), which covers over one million square km of Southeast Australia, has undergone extensive clearing for cropping and grazing, this and the use of ground water in irrigation alters the hydrologic balance. Reduced regional transpiration, due to land use change, increase recharge into local and regional ground waters. The subsequent rise in water tables causes water logging and has mobilizes soil salts, leading to dry land salinisation. Temporal change in soil moisture is a key parameter in locating sites of such land degradation, as well as in monitoring the effects of drought. Drought physically occurs when regional soil moisture stores fall below a certain threshold (Sivakumar 1991). Although this definition ignores the interactions with landuse and economics that characterize drought in social terms, accurate information on temporal and spatial changes in regional soil moisture stores and their relation to current landuse is critical for successful drought monitoring and declaration. Consequently, using Remote Sensing to monitor regional soil moisture has significant application for land degradation, drought and a variety of other environmental management issues such as crop forecasting, flood hazard and fire risk.
Regional water balance and soil moisture status may be studies using meteorological (met) data obtained from the sparse network of stations. The water balance model used may range from a simple index based on past rainfall, an Antecedent Precipitation Index (API), to complex models of water movement between soil layers and groundwater. Those used in drought studies in Australia have been summarized by White (1990). The difficulty with such modeling is that in simple models the parameters are aggregate and not easily associated with measurable field data, while complex models contain a large number of poorly or in-determined parameters. In each case, the problem is the lack of objective and goal-directed validation. Our aim is to use Remote Sensing to calibrate and validate regional water balance models and to disaggregate the regional soil moisture information spatially. This is done by capitalizing on the nature of remotely sensed observations of the energy balance as a means of validation, and its spatial image format as a tool for bringing the resulting information into coincidence with current land use.
The water and energy balances are coupled through evapotranspiration (ET) in which both water and energy are transported. This coupling is defined regionally by a landcover dependent “Operating Characteristic’ of the form:
E/Ep=f(W)
Where E is the (daily) ET, Ep is the potential ET and W is the available soil moisture. The ratio is called the ‘moisture availability’ (ma). It is possible to generate daytime and diurnal surface temperature indices using suitable process model as a function of met data, assuming that W is known (Jupp et al. 1990a). Modified resistance energy balance models (REBM) can be used for the daytime data (Jupp, 1990) and the heat flow equation must be solved for the diurnal surface temperature range (van de Griend et al. 1985). The moisture availability derived from the water balance model is a key input to the energy balance models, which conversely may be used with a time series of observed remotely sensed surface temperatures to calibrate and/or validate the temporal series of moisture information. Such a time series is available for the MDB using remotely sensed AVHRR data.
Physically based Environmental Modeling
Spatial and temporal variation in both day and night AVHRR thermal data is due to many environmental factors, including vegetation, soils, geology, topographic influences, the presence of water and ET, (Jupp et al. 1990a). The regional water balance is governed by two general factors: capacitance (Storage of water in the soil) and resistance (loss of water to the atmosphere). Variation in daytime surface temperature as measured using AVHRR data is largely due to surface resistance to loss of water by ET. Nighttime surface temperature, when the air and surface temperatures have equilibrated, responds strongly to the amount of stored water (or capacity) present in the environment (Jupp et al. 1990a; van de Greind et al. 1985).
2.1 Water Balance Models
A range of water balance models are being considered for this project. They are variations on the simple ‘bucket’ water balance model, which assumes the soil layer to be uniform and all the soil water to be available for ET, but can be disaggregated into more soil layers allowing differential drying between surface and lower layers (Hunt, 1985). Such models are a considerable simplification of the real world, but are resolvable at regional scales and capture the essential nature of the regional behaviour of soil moisture. Our approach is to let the data define the eventual complexity of the models used since complex models introduce unresolvable parameters. For example, using a two layer model (which may better represent many of Australia’s duplex soils) introduces the need for soil depths: twice as many operational parameters than required for the simple “bucket” model and more, importantly, a knowledge of boundary conditions between the soil types are needed. Such information is not known at regional scales in Australia through field measurements.
The base (one layer) model we are using is a generalization of the Choudhary et al. (1987) API and Keig and McApline’s (1974) WATBAL model. The model has been implemented on a PC and provides routine estimates of regional soil moisture for the MDB. The met data requirements for the model are maximum and minimum air temperatures and daily rainfall, which are recorded by all Australian Bureau of Meteorology (ABM) stations. Within the MDB there are 80 met stations which have been recording continuously since 1980. As an initial trial for the validation sequence, the base water balance model has been run from 1980 to the present for the stations in the MDB. Having a lead time of 6 years before the first comparisons with AVHRR data allows initial conditions to be absorbed by the models. Two controlling parameters soil water holding capacity (Wmax) and a resistance to the loss of water by the upper layers of the soil(b), are used to define the operating characteristic (f(W)) for a given area :
These two parameters may be tuned to bring time series of available soil moisture into agreement with the remotely sensed surface temperature data in the one-layer ‘bucket’ model.
2.2 Energy Balance Models
For daytime data, a resistance energy balance model was used to convert the water balance modeled ma to a modeled surface temperature that can be compared with the observed surface temperature. The model used has been described in Jupp (1990). An overview of REBM is given in Monteith and Unsworth (1990) whereas a detailed description of model implementation offered in micro-BRIAN can be found in Jupp Kalma (1989). The diurnal temperature range (DTR) is governed by heat storage and heat flow in the upper layers of the soil; this is affected by the amount of water present in the upper soil layers. Thermal inertia, a combined property of thermal conductivity and volumetric heat capacity, inversely relates the soil moisture content and the DTR. To model the DTR, we are using a fourier-based method modified form Henchinger et al. (1982), with attention to the initial-value problems (price 1989) that short data period can create. The fourier method is used to estimate the diurnal heat flux into the soil and the actual surface temperature is finally adjusted using a 2-layer model which takes vegetation cover into account so that the energy balances hourly.
2.3 Temporal Interpolation of Daily Parameters
The temperatures measured by the AVHRR relate to the energy balance at a specific time of day, whereas the met data provide only a daily summary. Therefore, for a given met station the daily course of the air temperature, relative humidity and global shortwave irradiance need to be estimated. As a step towards achieving this we are evaluating a modified version of the program MTCLIM (Hungerford et al., 1989) due to R. Nemani (1991, Pers. Comm.) called HOURLY. This model requires maximum and minimum air temperatures, daily rainfall, site position, site horizons and albedo as inputs. Met data the same as required by the water balance model and horizon/aspect information may be extracted from the DEM. Some recalibration has been needed for Australian conditions, and a robust method for temporally interpolating the daily met to hourly data has emerged.
Results and Discussions
The met data were obtained from the ABM and consist of 80 stations within the MDB. Data outside the MDB have also been purchased to allow interpolation to the boundary. Records have been acquired from the beginning of 1980. Of the 80 sites within the basin, 50 sites have clean data and can be used with confidence. The other 30 sites have missing months and numerous combined weekend periods. Verification of the data is underway to ensure that clean data is used in the models. The resulting water balance models give robust results of regional soil moisture which are functions of the operating characteristic defined for the region. Fig. 1 shows a plot of the WATBAL soil moisture versus time for Cobar from 1980 to 1989 inclusive. The operating characteristic used in this model was defined using a Wmax of 200 and b of 1.25. Similar test runs have been made for the other stations in the MDB.
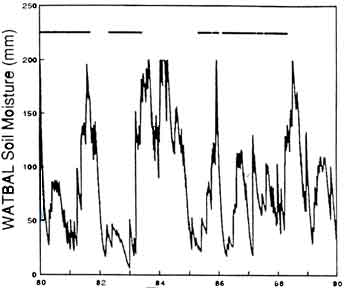
Fig. 1 WATBAL soil moisture for Cobar 1980-1989 (Wmax=200m,b = 1.25). Horizontal line indicates declared drought periods(NSW Ag. Dept.)
Validation of the temporal interpolation from daily met data to hourly data has been undertaken for a number of sites where actual hourly data is available. Hourly air temperature and humidity data recorded during 1989 from a CSIRO experimental site at Lockyersleigh was used for the comparison. Global (direct and diffuse) shortwave irradiance data for 1989 collected by the ABM for Canberra was used for the validation of the shortwave radiation environment. Generally, results showed good agreement between the modeled and observed parameters for clear days. Plots showing the differences between actual and modeled air temperatures and relative humidities from the Lockyersleigh data for Julian days 40 to 49 are presented in Fig. 2 and 3. The average difference between actual and modeled air temperature for 13:00 to 15:00 local time, during which the daytime overpasses occur, is -0.234°C with a standard deviation of 0.298°C for 70 non-rainy days. The corresponding average difference in the measured and modeled relative humidity is 3.378% with a standard deviation 9.323% for 70 days.
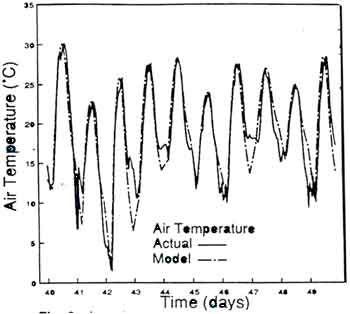
Fig. 2 Actual and modelled hourly air temperature for Julian day 40-49. Lockyersleigh data.

Fig. 3 Actual an modelled houly relative humidity for Julian day 40-49, Lockyersleigh data
The radiation component of the interpolation is based upon a relationship between diurnal temperature range and atmospheric transmissivity (Tt) proposed by Bristow and Campbell (1984):
Where DT is a difference between daily minimum and maximum air temperature, modified for cloudy and rainy days and A, B and C are empirical coefficients. Differences were found between the measured and modeled global radiation when using the empirical coefficients determined in North America. Analysis of actual transmissivity obtained from Australian data provided us with the opportunity to refine the constants to better approximate local conditions. The resulting values for A, B and C were found to be 0.77, 0.006 and 2.3, compared with the North American values of 0.79, 0.003 and 2.4 respectively. The influence of position and seasonality on these constants is being analysed at other sites where the global shortwave of radiation environment is recorded. Fig. 4 illustrates the difference between the global shortwave radiation environment is recorded. Fig. 4 illustrates the difference between the actual and modeled global shortwave irradiance for Julian days 40 to 49. The average difference between the hours of 13:00 to 15:00 of global irradiance for 190 clear days is 62.48 WM-2 (4.2% of actual) with a standard deviation of 539.19 WM-2 (31% of actual). As days where we obtain remotely sensed observations are clear, the modeling can be considered completely effective for the purposes of our work.
Fig. 4 Actual and modelled houly global shortwave irradiance for Julian day 40-49, Canberra data.
The AVHRR data set for the project consists of 255 images recorded since March 1983. From June 1986 we have 82 days-night pairs, with at least one pair per month. Before this data the archive us gappy.
The day-night pairs have been processed to provide surface temperature estimates and have been saved or an erasable optical disk. Detailed analysis has been undertaken for the Cobar met station for 1989. The actual surface temperatures for the 12 day-night pairs and another 8 day images were extracted from the remotely sensed images using the microBRIAN Image Processing System. The REBM analysis was applied to the 20 day images. Data inputs required for the modeling are surface temperature (obtained from the Remote Sensing observation), air temperature, global radiation and relative humidity (derived from the daily met data using HOURLY for the time of the overpass). Windspeed, LAI and albedo were estimated and held constant for this modeling.
For daytime data, there is a strong relationship between the differences in surface and air temperatures and the water balance – defined ma, as shown in Figure 5. This results illustrates how the partitioning of global shortwave radiation is dependent on ma. When ma is low, the surface temperature becomes greater than the air temperature as more incoming radiation is partitioned to sensible heat. Results for Julian day 12 appear anomalous on the graphs shown. These data, as well as the set of days in the next summer (Julian day greater than 300), are also points of departure between the REBM ma and the water balance ma. The differences seem to be due to the differing way that potential ET is handled between the two models as well as to the single layer bucket used for this initial test. Both these issues are the subject of current work. Initial analysis of the day-night data also shows a strong relationship between the day-night surface temperature difference and the water balance ma, illustrated in Fig. 6. This is due to the relationship between stored moisture and both resistance and capacitance. The thermal inertia increase due to stored moisture and both resistance and capacitance. The thermal inertia increase due to stored water provides additional force for the calibration of the water balance model.
Fig. 5 Difference between surface and air temperature against WATBAL Ma, numbers reresent Julian day.
Fig. 6 Difference between day and night surface temperatures against WATBAL Ma numbers represent Julian day.
Future work and Collaboration
Current modeling is being undertaken at and in the vicinity of the 80 met stations in the MDB. To successfully complete the project, the MDB will be stratified into regions of similar resistance and capacitance, termed hydrothermal regions (HTR) (See Jupp et al. 1990b) in the raster GIS environment offered in microBRIAN . Due to the sparse nature of the met station network, there will be many HTR’s in which no met data will be available. Met data will be interpolated to create virtual met stations in these regions. For each HTR the water balance model will be compared against the remotely sensed observations. Once the water balance models have been tuned for each HTR and its corresponding met stations (real or virtual), the spatial variation in the remotely sensed day and night surface temperatures will be used to spatially distribute soil moisture.
In a way similar to the MDB project, the North China Plain is being studied extensively with thermal, reflective and radar Remote Sensing at regional and local scales at the Chinese Academy of Sciences. A joint Australia-China project has been established with initial reciprocal visits occurring in the last quarter of 1991. Extended visits lasting roughly 6 months will take place in 1992 to allow further collaboration and exchange of physically based models and field techniques between the two countries. Presently, data sets are being collated and anlaysed within the two countries and test sites selected to allow data and model exchanges.
Conclusions
From the results presented, we believe the energy balance modeling and temporal met data interpolations provide a powerful tool for validating and calibrating operational soil moisture monitoring based on regional water balance modeling. In the future, the tests will be extended systematically to more complex water and energy models to evaluate the necessary complexity needed for the technique of effectively operate. Spatial stratification and interpolation will be added once the modeling is stable near the stations to provide regional soil moisture estimates for the entire MDB. This modelling will be available in microBRIAN offering technology transfer of the procedures developed.
Acknowledgements
The research is supported by the Land and Water Resources Research and Development Corporation (LWRRDC) Department of Primary Industry and Energy, Australia. The assistance of Elizabeth
McDonald, Guy Byrne, Barbara Harrison, Paul Hutton, Randall Gray, Haralds Alksnis and Chris Barnes in the preparation of this paper and performing this research is gratefully acknowledged.
References
Bristow, K.L. and Campbell, G.S. (1984). On the Relationships between Incoming Solar Radiation and Daily Maximum and Minimum Temperature. Agricultural and Forest Meteorology, 31, 159-166.
Choudhury, B.J., Owe, M., Goward, S.N. Golus, R.E. Ormsby, J.P. Chang A.T.C. and Wang, J.R. (1987) Quantifying spatial and temporal variabilities of microwave brightness temperature over the US Southern Great Plains, International Journal of Remote Sensing, 8, 177-192.
Henchinger, E., Raffy, M. and Becker, F. (1982) Comparison between the accuracies of a new discretization method and an improved fourier method to evaluate heat transfers between soil and atmosphere, J. Geo-Phys. Res. 87, 7325-7339.
Hungerfod, R.D., Nemani, R.R. Running S.W. and Coughlin, J.C. (1989) MTCLIM: A mountain microclimate simulation model. USDA Intermountain Research Station Research Paper, INT-414, November 1989. 52p.
Hunt, B.G. (1985) A model study of some aspects of soil relevant to climate modeling. Quart. J.R. Met. Soc. 111. 1071-1085.
Jupp, DLB(1990). Constrained Two-layer models for estimating evapotransporation. Proceedings of the 11th Asian Conference on Remote Sensing, Gaungzhou, China, November, B.4.1-B.4.6
Jupp, D.L.B Walker, J., Kalma, J.D. (1989) Distributing evapotranspiration in a catchment using airborne Remote Sensing. Asian-pacific Remote Sensing Journal 2, 13-26.
Jupp, DLB Walker, J., Kalma J.D. and McVicar, T.R (1990a) Using Thermal Remote Sensing to Monitor land Degradation and Salinization in the Murray-Darling Basin of Australia. Proceedings of the Twenty-Third International Symposium On Remote Sensing of the Environment, Bangkok, Thailand, April 18-25, 1011-1021.
Jupp, D.L.B., McVicar, T.R. Walker, J. and Dowling, T.I (1990b) using AVHRR Data, Image Processing and GIS Methods to Monitor the Spatial Changes in Land Degradation and Salinization in the Murray-Darling Basin of Australia. Proceedings of AURISA 90, Canberra, November 21-23, 95-103.
Keig, G. and McAlpine, J.R. (1974) WATBAL: A Computer system for the estimation and analysis of soil moisture regimes from simple climatic data. CSIRO Davison of Land Use Research Technical Memorandum, 74/4.
Monteith, J.L. and Unsworth, M.H (1990) Principles of Environmental Physics, 2nd Edition, Edward Arnold, London.
Price, J.C. (1989) Quantitative aspects of Remote Sensing in the Thermal infrared. G. Asrar (Ed.) Theory and Applications of Optical Remote Sensing. John Wiley & Sons, NY, 578-602.
Sivakumar, M.V.K. (1991) Drought Spells and Drought Frequencies in West Africa, Research Bulletin No. 13, International Crop Research Institute for the Semi-Arid Tropics, Pataanchera, Andhra Pradesh, India, 19p.
White, D.H. (1990) A study of the Feasibility of using Simulation Models and Mathematical Programs as Aids to Drought Monitoring and Management. Bureau of Rural Resources, information Paper No. IP/2/90, Dept of Primary Industries and Energy, 126p.
Van de Griend, A.A, Camillo, P.J. and Gurney, R.J. (1985) Discrimination of Soil Physical Parameters, Thermal Inertia and Soil Moisture from Diurnal Surface Temperature Fluctuations. Water Resources Research, 21, 997-1009.