| GISdevelopment.net ---> AARS ---> ACRS 1980 ---> Technical Session |
Photographic analysis of sand
flow in maowusu sandy land
Mao Zan
You
Department of Geography,
Beijing University.
Department of Geography,
Beijing University.
Maowusu Sandy Land, Situated at 37°30’-39°30’ N and 107°20’-111°30’ E, with an attitude of 1100-1500 m. Its total area is 38935 sq.km which is about 3.6% of the total area of desert in China.
Main reasons for developing of following sand
Formation of sandy land has its own factors in natural conditions and human activitives, As the natural conditions are concerned, the rolling hills in this area are mainly composed of horizontal rock layer of Cretaceous purplish red and Jurassic grayish green sandstone, for that reason, various types of deposit and eluvial of Quaternary period in this area all possess of sandy characteristics, and the deposits along the river banks are of medum sized fine sands and silt.
As to the meteorological conditions the average annual precipitation amounts to 440 mm only in southeast part and decrease to 250 mm in northwest to Maowusu sandy lands. Most of the year’s rainfall concentrates in the month of July and August and generally in the form of rainstorm. The annual variability from year to year is very big. There is a year of drought every 2-3 years, and a serious dry year every 6-7 years. Due to the influence of the high pressure and cold fronts from Mongolia. The northwest sand-driving wind (6 m/s) in the seasons of spring and winter as very frequent. Since the fifteenth century, the frequency of sand-
- Maowusu Sandy Land is situated in the belt of dry grass land, the
natural condition there are different from those in sandy desert in
Northwest of China. So our department has initiated the term “Maowusu
Sandy Land” instead of “Maowusu Sandy Desert”.
 |
| |
 | ||
It can be seen that the unrational use of land has brought diverse effects on developing flowing sand in this area. Although the annual precipitation in southeast part is almost doubled than that in northwest, but the situation of flowing sand in south, however, is more serious than in northwest. Because of the historical and human factors.
| Region | % seriously desertified land | % desertified land in the developing | % lightly desertified land |
| SEMiddleNW | 74.7 47.8 36.9 |
13.9 15.1 12.4 |
11.4 39.1 50.7 |
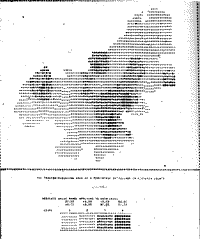
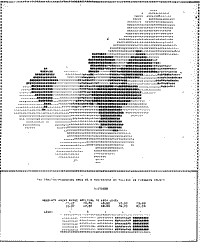
Expanding of flowing sand seen between aeraal photographic of 1959 and 1978.
It has always been the basic method by using the aerial photographs in interpretating the wind-sand movement, predicting its developing trend and distinguishing the types of the sandy land. After analyzing the images of 18 years interval between 1959 and 1978 shows that there are desertification, as the natural condition and human activities overcome the natural renewal capability and thus destroying the ecological balance system of that area.
- In hilly regions, the sediments of wind erosion have gathered in the downstream along the wind direction and thus the sandy land spreads. Along the Wu-ding, Jia-lu and To-vi River, the flowing sand of these three river like three piece of dagger pierces into the loess areas. In the middle section of the Tsing-young mountain, the southeast of Yu-lin, about 33.2% of the total land in 1958 had been seriously effected by flowing sand. By the year of 1976 it has the tendency to increase to 40.1%. In the loess hill along the Jia-lu River the area of flowing sand in 1976 has been increased to 29% and at a short distance of only 20 km from the bank of Huanghe River.
- On the beach land, the erosion of flowing sand mainly occurred in residential districts, farmlands, grazing land or near artesian wells. Its characteristics of distributed patterns are either in dots or schistose and in a way of over lapping with the fixed dunes.
The kinds of bushwood composed of shrub and Salix fruticeta had been very common and widely distributed in this area, they are very useful, but after 18 years of drought, defrostation and over-grazing the bushwood area decreased about 35.7%, and desertification area increased 20-30%.
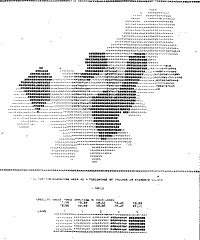
Classification of desertification in the photographs.
As we know the purpose of studying the movement of sand flow is prevent and control the spreading of desertification.
The effects of such factors as natural condition and human activities must taken into consideration in photo-interpretation of desertification. Whatever these factors are and what kinds of effects they might have caused, the basic identification for ultimate outcome of desertification is that there are flowing sands appear on the ground surface. So it can be fairly said as to what extent the flowing sand appeared, and the area size the flowing sand occupied in an area are two of the most sensitive, precise and quantitative criteria in photo-interpretation and mapping of desertification process.
In determining types of desertification from airphoto, there are altogether 6 types as follows:
- Potentially desertified land, including primary grassland which is not been ruined and wetland, had not been covered with sand. The ground surface has not deflation and sand deposition, while vegetation is still in the stable stage with a total coverage more than 40%.
- Lightly desertified land. Therefore dots of flowing sand and light wind erosion on the ground surface, as well as floated shrub forest. There are grayish –white dots appeared on darker color tone background.
- Desertification developing land. It means that migrative dunes and floated shrub forest are distributed in sheet form on the ground surface, and occupies about1/3 of the land. The effects of sand and wind tends to enlarge the area of desertification. On the aerial photographs due to sand-cover over the ploughed land, there are a number of white dots as well as an image of grayish-white color.
- Desertified land in reversed direction. Here “reverse” means that a great number of sand binders have been budding in the sand dunes. Desertification process might have been suppressed to certain extent, with increasing number of black dots on the wind ward slope in the airphoto.
- Seriously desertified land is that there are 1/3 to 2/3 of the ground surface covered with migrating sand dunes, the sand piles of no fixed shapes appeased while the vegetation coverage decreased. The white dots in the image increased.
- Extremely desertification land, means that more than 2/3 of the ground surface area covered with migrating sand dune and Vegetation coverage is less than 10%. In the airphoto the grayish-white color tone in continuous form.
Conclusion
ERTS image, multispectra photographs and some other measures may be used to understand the movement of flowing sand and desertification degree for a certain region, and when in compares them with ordinary aerial photographs, there is no doubt that the former has more function than the latter. For example, the ERTS imagery offers an opportunity for us to observe as first hand now important. It is our responsibility in the management and control of the desertification of the Maowusu Sandy land. However it is not possible for using multidate photographs to study all the desert regions.
As to what is going to be done in order to improve human environment, we have tired so far, within our economic capability to use the most advanced technique and sophisticated instrument, to provide practical information for analysis and to achieve the ultimate goal of effectively control of the process of regional desertification.
Mapping is that it is possible to produce maps with different classification methods using same date so that the most effectiveness of the classification can be evaluated. Number of classes and class limits depend on the quality and number of original data, and the range between the smallest value and the largest value. The choice of classification methods is based on specific features and their distribution; these methods include arithmetic progression, geometric progressions, standard deviation, equal steps, cluster, and others.
Designing the areal symbols
Areal symbols used in mapping statistical data are made for the line printer mapping and plotter mapping. These areal symbols include standard printer characters, their combinations, and shading patherns with different line type and line spacing parameters for each class. Each areal symbol provides a respective gray value. The goal is to design areal symbols which will allow the map reader to visually differentiate one kind of area from another, and should show differences in amount or degrees. The experiment indicated that gray tones of 10 classes can be visually identified (Table 1)
| 1 | 2 | 3 | 4 | 5 | 6 | 7 | 8 | 9 | 10 | |
| 1 | . | , | - | = | + | X | O | N | O | M |
| 2 | + | Z | X | I | ||||||
| 3 | H | W | ||||||||
| 4 | O |
The experiment is controlled by a series of subroutine, each consisting of a control word followed by a parameter list. Each subroutine initiates a particular program function (Table 2). By altering parameters, different categories of thematic maps can be produced, these maps include choropleth, isopleth, proximal, and classification maps.
| Name of subroutine | Program function |
| Data file | Input thematic data and coordinate pairs of position points |
| Classify | Compute class limits and convert thematic data to classes |
| Symbol | Construct line printer symbols |
| Legend | Plot title, scale and legend |
| Plot | Output a variety of thematic maps |